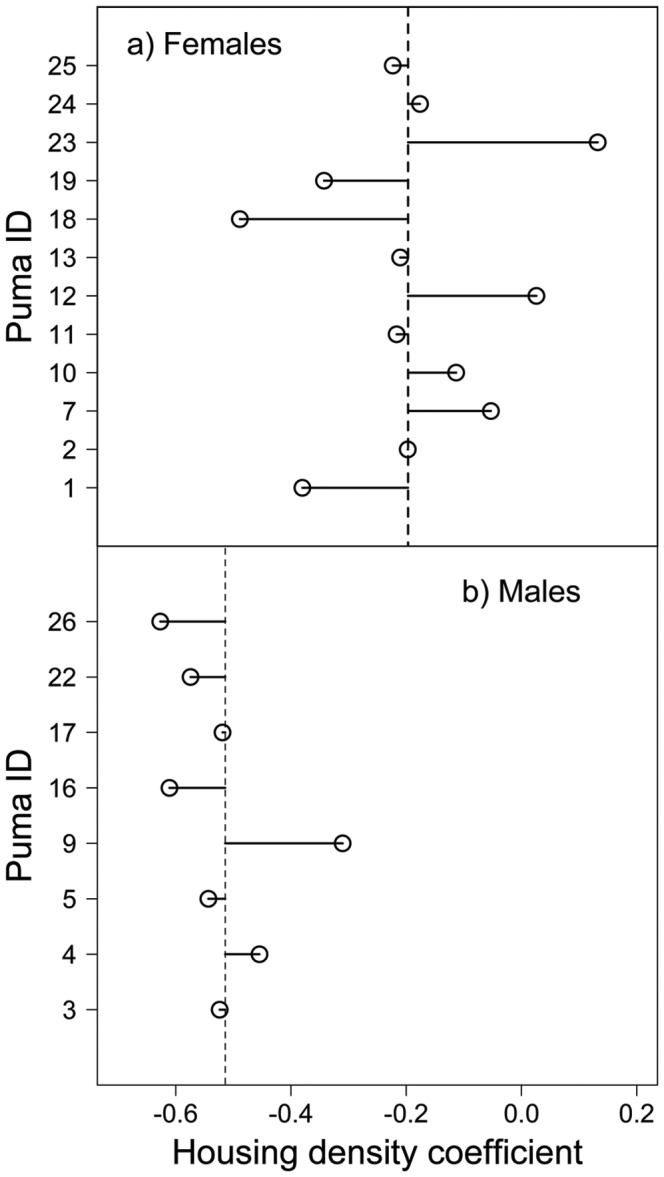
Figure 3. Estimates of the random effect coefficient of housing density for each puma are plotted in relation to the marginal prediction (dashed line) for a) females and b) males.

Females were more tolerant of human development and displayed greater variation in their response than males, likely due to life history differences related to breeding and raising young. The sole dispersing male (M9) in our sample exhibited a tolerance of housing density more similar to that of females than other males.
