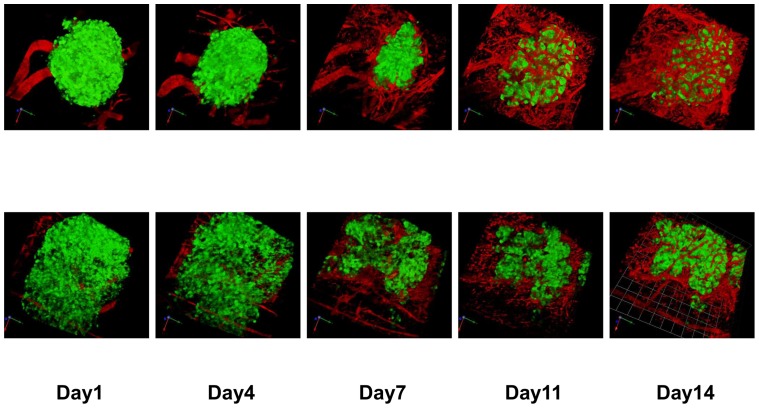
Figure 3. Imaging of the transplanted islets and surrounding blood vessels.
Overlay of GFP fluorescence (pancreatic islets) and Texas Red fluorescence (blood vessels). Upper row: islets in the control group, Lower row: islets in the tacrolimus-treated group. GFP and Texas Red were excited at 890 nm. The scale bar indicated 51.0 μm/unit.

