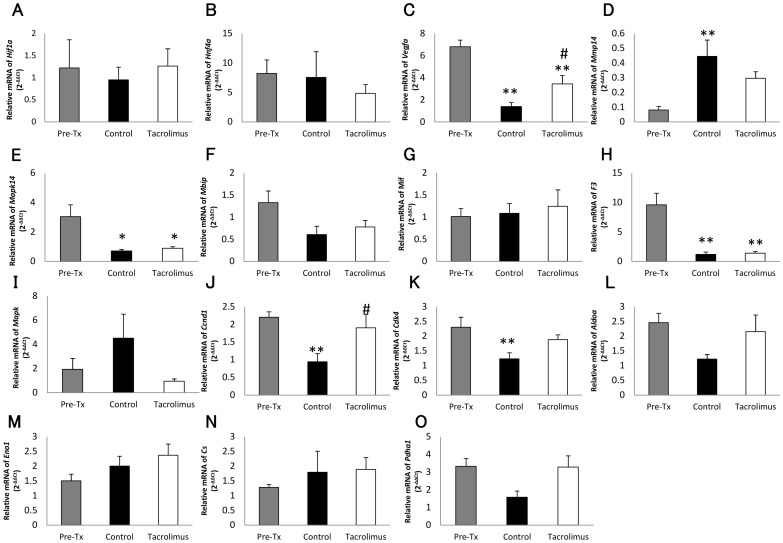
Figure 7. Relative gene expression in the transplanted pancreatic islets with and without tacrolimus.
Relative gene expression of Hif1a (A), Hnf4a (B), Vegfa (C), Mmp14 (D), Mapk (E), Mbip (F), Mif (G), F3 (H),Il1b (I), Ccnd1 (J), Cdk4 (K), AldoA (L), Eno1 (M), Cs (N), and Pdha1 (O) in islets before transplantation (gray bar), the control group (black bar), and the tacrolimus-treated group (white bar). The values in the control and tacrolimus treated-group were represented as the ratio to the values in islets before transplantation. *P<0.05 in comparison to the islets before transplantation, **P<0.01 in comparison to the islets before transplantation, and #P<0.05 in comparison to the control group.

