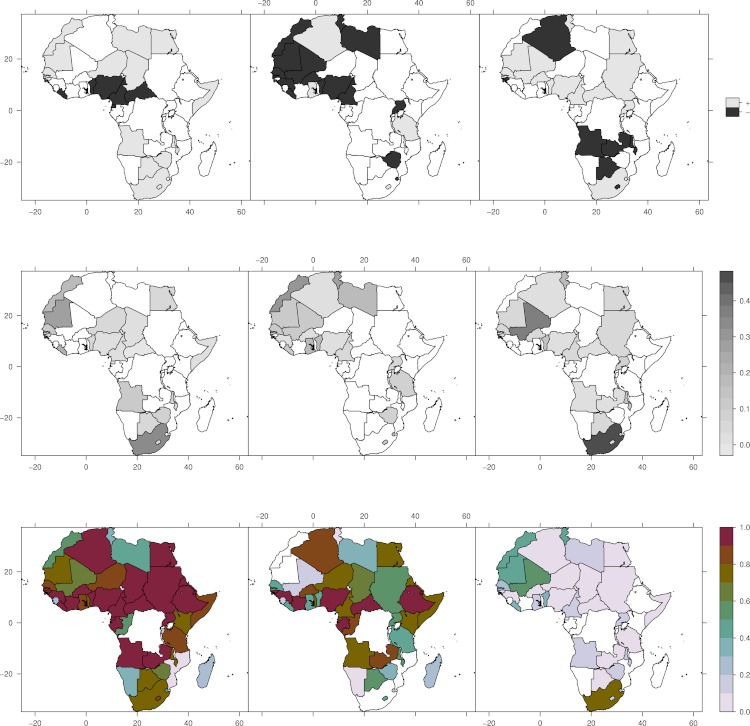
Figure 2. Effect of climate variability on cattle holdings.
Upper panel (left to right): Sign of slope for precipitation (P), wet season temperature (Tw), and dry season temperature (Td). Positive values means increased precipitation/temperature is associated with increased number of cattle and vice versa. Middle panel (left to right): Percent variance explained by precipitation, wet season temperature and dry season temperature. Lower panel (left to right): Total variance explained by the model, variance explained by variability in Gompertz function, and variance explained by climate variability.

