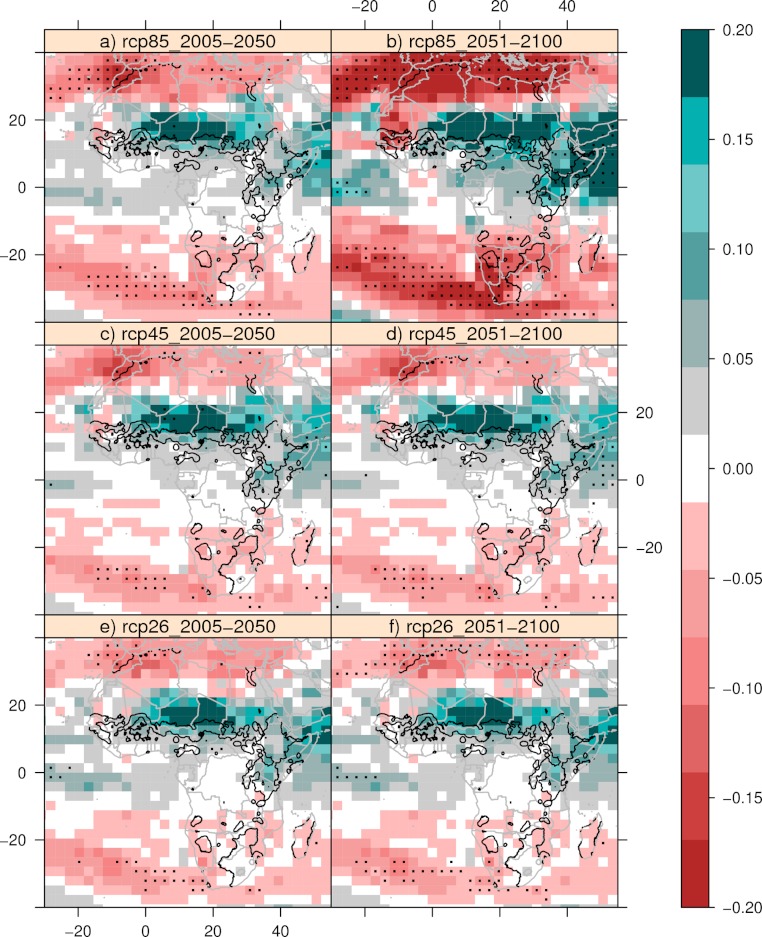
Figure 4. Future precipitation patterns.
The mean expected changes from 1961–2000 in precipitation under three different climate scenarios. Shading indicate standard deviations, black contours show the presence of cattle in the 1960s. Only values where more than 66% of the models agree are shown. Black dots indicate more than 90% of the models agree on the sign of change.

