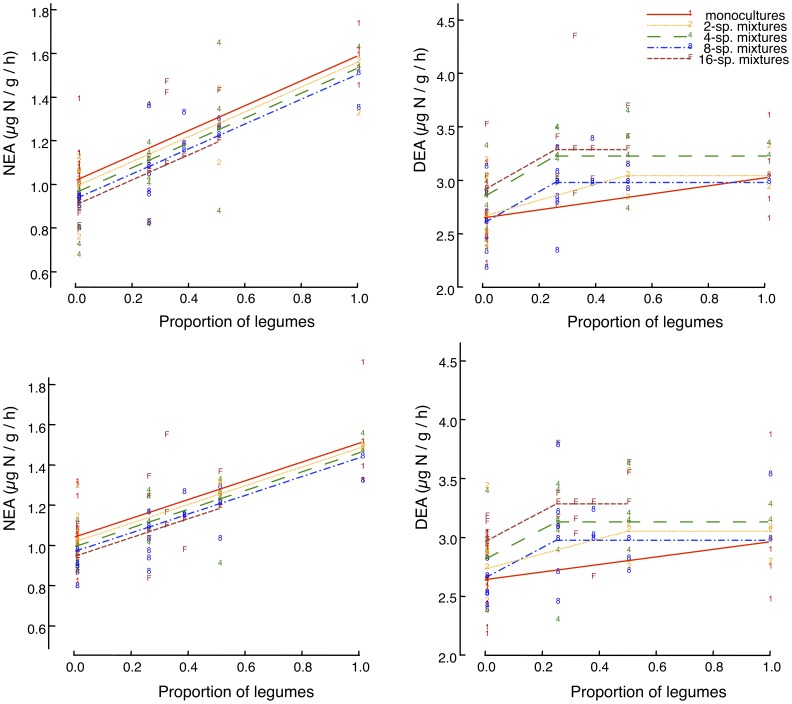
Figure 2. Unravelled effects of Legumes And Plant Species Richness On Soil Enzyme Activities.
Changes in (left) NEA and (right) DEA as a function of the proportion of legumes within the plant community (x-axis) and plant species richness in the community (numbers associated to points). Data are presented for (top) 2006, and (bottom) 2007. The lines connect fitted values from corresponding multiple regression models with significance levels presented in Tables 1 and S1. For example, for the NEA-2006 plot (top, left), the increase of NEA with the proportion of legumes at a given richness level is significant at p<0.001 and the continuous increase of NEA with richness is significant at p = 0.009. Note that for NEA the five regression lines are not all significantly different from each other, but reflect the significant change with log richness (for each doubling of species richness the lines move down by a constant distance), which is different for DEA.

