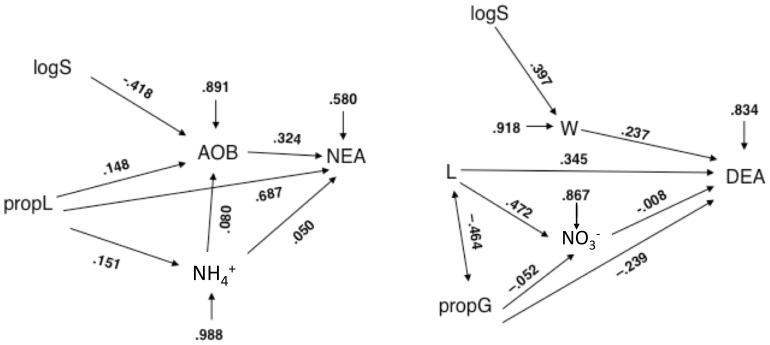
Figure 6. Path Diagram: Plant Diversity Components, Environmental Soil Variables, Microbial Abundances and Enzyme Activities.
Path diagram for effects of plant diversity components on NEA and DEA, showing how observed effects can be explained entirely or partly by indirect effects via microbial abundance and key environmental drivers for (right) nitrifiers and (left) denitrifiers (2006 data). Lack of fit of path models was not significant for NEA (χ2 = 1.38, d.f. = 3, P = 0.71) or significant for DEA (χ2 = 19.53, d.f. = 7, P = 0074). Path coefficients indicate by how many standard deviations the effect variable would change if the causal variable were changed by one standard deviation.

