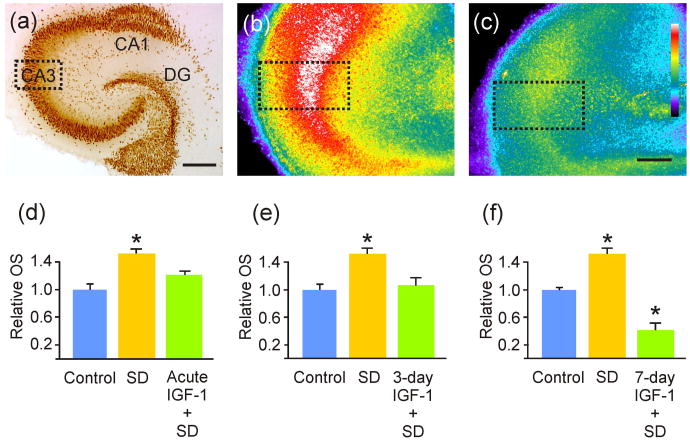
Figure 2. IGF-1 decreased oxidative stress from spreading depression.
(a) NeuN immunohistochemical labeling of a hippocampal slice culture, for cytoarchitectural reference and to show the CA3 area of interest (dotted line box) used for quantification of oxidative stress (OS) via CellROX™ fluorescence intensity. (b-c) Representative CellROX™-labeled hippocampal slices exposed to SD (b) and to 3-day IGF-1 incubation followed by spreading depression (SD) (c). Dotted line boxes illustrate CA3 areas of interest used for relative OS quantifications. (d) OS was significantly (*p = 0.008) increased from controls after hippocampal slice cultures were exposed to SD, and this effect was abrogated when exposed to IGF-1 acutely (n = 21, 12 and 9 for control, ‘SD’ and ‘SD + IGF-1’ slices, respectively). (e) Similarly, the significantly (*p = 0.007) increased OS induced by SD was abrogated when slices were exposed to IGF-1 for 3 days prior to SD (n = 21, 8 and 6 for ‘SD’ and ‘SD + IGF-1’ slices, respectively). (f) The significant increase in OS from SD (*p < 0.001), when compared to controls, was significantly reduced (*p < 0.001) in slices exposed to IGF-1 for 7 days prior to SD induction (n = 21, 12 and 3 for ‘SD’ and ‘SD + IGF-1’ slices, respectively). Note: IGF-1 exposure was continued for the additional 24 hour CellROX™ incubation. Scale bars = 400 μm (a) and 200 μm (b and c). Comparisons between groups were made via ANOVA plus Holm-Sidak post hoc testing.

