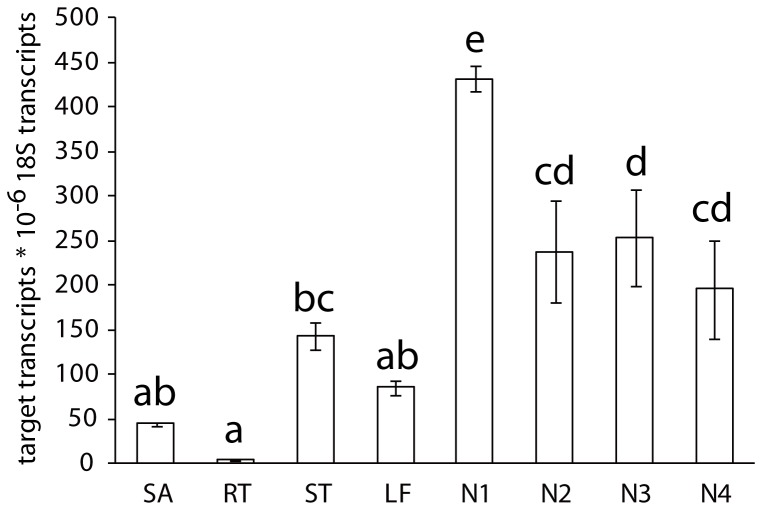
Figure 4. Transcript levels of DgBRC1 in different tissues.
Total transcript levels of DgBRC1 in different tissues were analyzed by real-time PCR. Bud position was recorded basipetally. Error bars indicate SE from three biological replicates consisting of 10 plants for each replicate. Abbreviations are SA, shoot apex; RT, root; ST, stem; LF, leaf; N1, node 1; N2, node 2; N3, node 3; N4, node 4.

