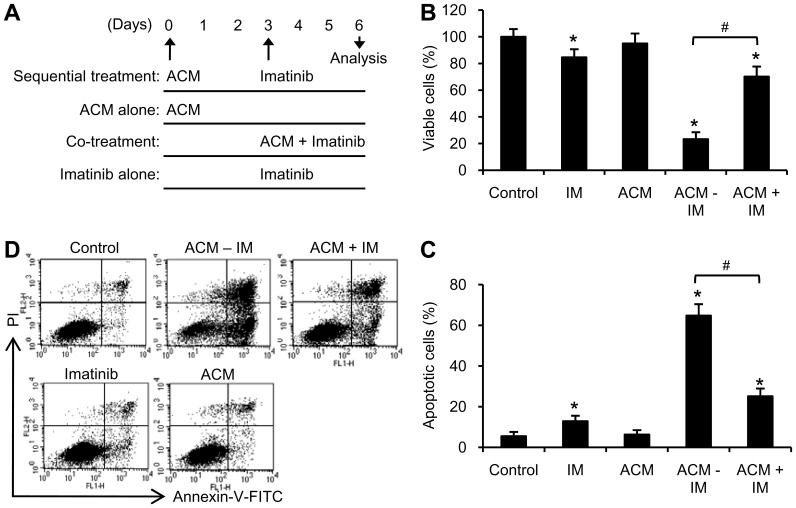
Figure 2. Sequential treatment with ACM and imatinib strongly induced growth inhibition and apoptosis in K562 cells.
(A) Treatment scheme for ACM and imatinib in K562 cells. Sequential treatment (SE): cells were treated with 10 nM ACM for 3 days and then with 200 nM imatinib for additional 3 days (ACM-IM). ACM alone treatment: cells were treated with 10 nM ACM for 6 days. Co-treatment (CO): cells were simultaneously treated with 10 nM ACM and 200 nM imatinib for 3 days (ACM+IM). Imatinib alone treatment (IM): cells were treated with 200 nM imatinib for 3 days. (B) K562 cells (1.25×10⁴ cells/ml) were seeded in 96 well plate (200 µl per well) and treated as described above. Cell viability was analyzed by MTT assay. (C) Cells (1.25×10⁴ cells/ml) were seeded in 6 well plate (3 ml per well) and treated as described in Figure 2A. Apoptotic ells were stained with annexin V-FITC and PI and analyzed by flow cytometry. Values are mean ± SEM from four experiments. *, p<0.05 versus untreated control. #, p<0.05 (B and C). (D) Flow cytometry data show representative results from one of four independent experiments.

