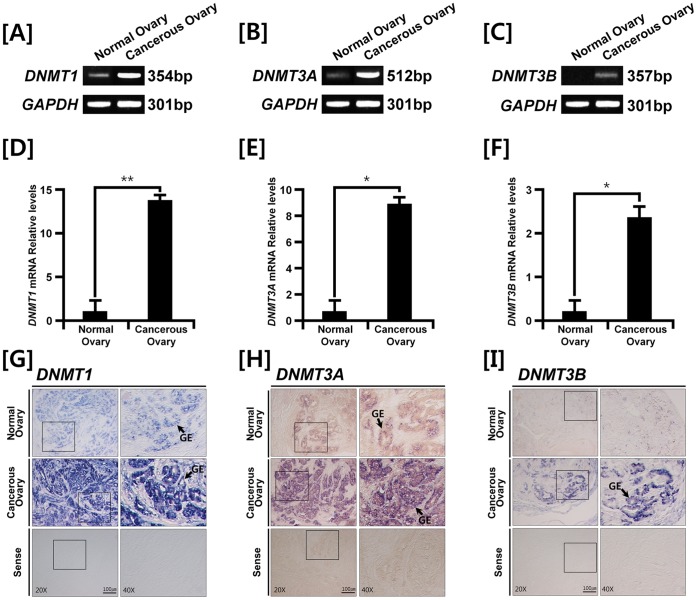
Figure 1. Expression, quantitation and localization of DNMTs in normal and cancerous ovaries from laying hens.
[A–C] RT-PCR and [D–F] q-PCR analyses were performed using cDNA templates from normal and cancerous ovaries of laying hens using chicken DNMT1, DNMT3A, DNMT3B and GAPDH primers. The asterisks denote statistically significant differences (**P<0.01 and *P<0.05). [G–I] In situ hybridization analyses of DNMT mRNAs in normal and cancerous ovaries of hens. Cross-sections of normal and cancerous ovaries of hens hybridized with antisense or sense chicken DNMT cRNA probes. Legend: GE, glandular epithelium. See Materials and Methods for a complete description of the methods.

