
Figure 3. Differentially expressed splicing factors.
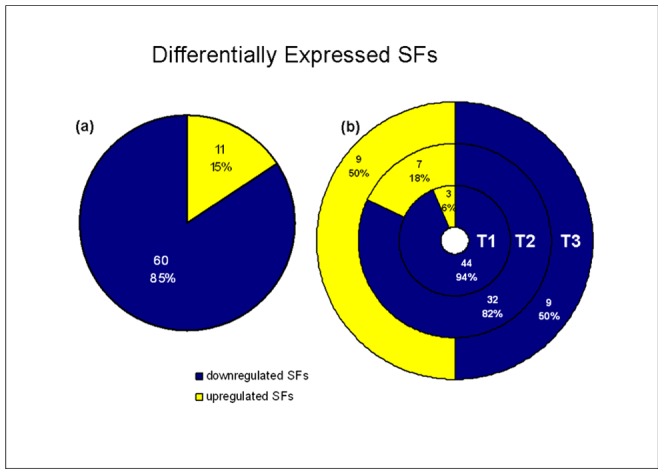
(a) Overall trends of expression of the splicing factors (b) Trends of expression of the splicing factors across the analyzed timepoints: T1 (4 h), T2 (8 h), T3 (18 h) – percentage of the up and downregulated splicing factors.