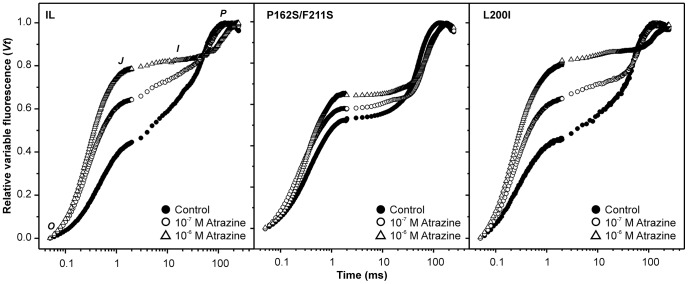
Figure 3. Polyphasic chlorophyll fluorescence transient under different atrazine concentrations.
The fluorescence transients of reference strain IL and P162S/F211S and L200I mutants are presented as curves of the relative variable fluorescence, Vt = (Ft-F0)/(Fm-F0). Typical Vt curves for each strain and herbicide treatment are presented; the characteristic points O-J-I-P are also indicated.

