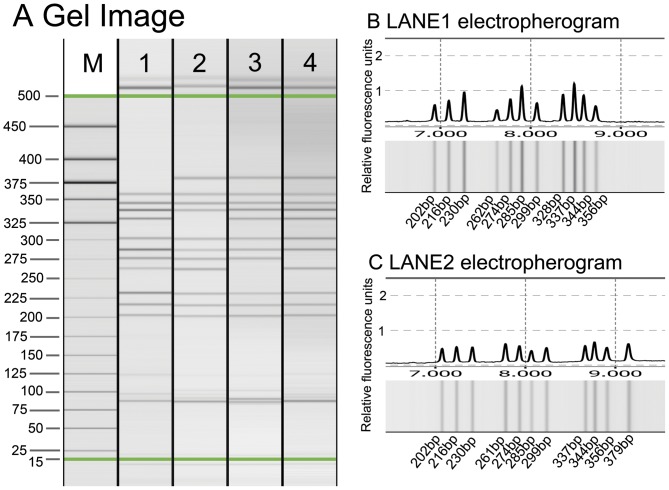
Figure 1. Electrophoresis result of 4 samples with most number of amplicons.
A: gel image of the 4 samples. B. Gel image and electropherogram of sample in lane1. 11 bands ranging from 202 to 356 bp were observed, indicating 5 heterogenous and 1 homogenous SNPs were identified C: Gel image and electropherogram of sample in lane2. Another combination of 5 heterogenous and 1 homogenous SNPs were observed.

