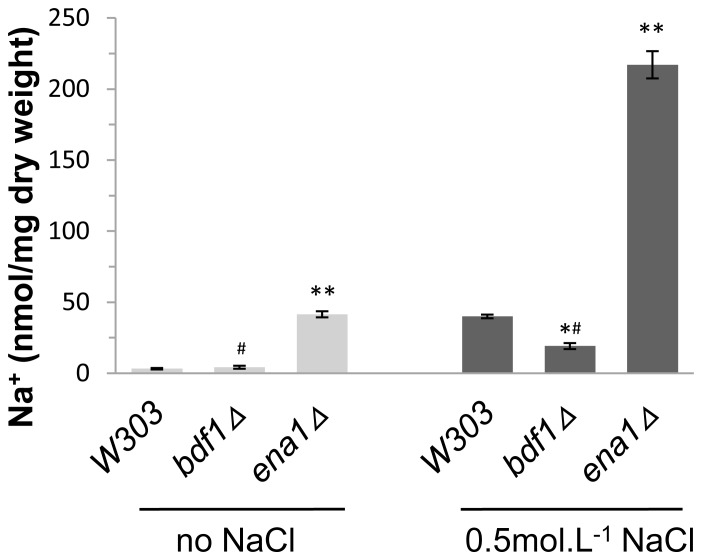
Figure 1. The intracellular Na+ concentration in bdf1Δ was lower than that in wild type.
Mid-log phase cells were grown for 5 h with or without 0.5 mol.L−1 NaCl. The treated cells were washed with MgCl2 and air dried. The dried cells were nitrified with nitric acid. The Na+ concentration was analyzed by atomic absorption spectrophotometry at 589 nm. Error bars denote standard deviation (SD). *P<0.05, **P<0.01 vs. wild type under the same treatment, # P<0.01 vs. ena1Δ under the same treatment, n = 3.

