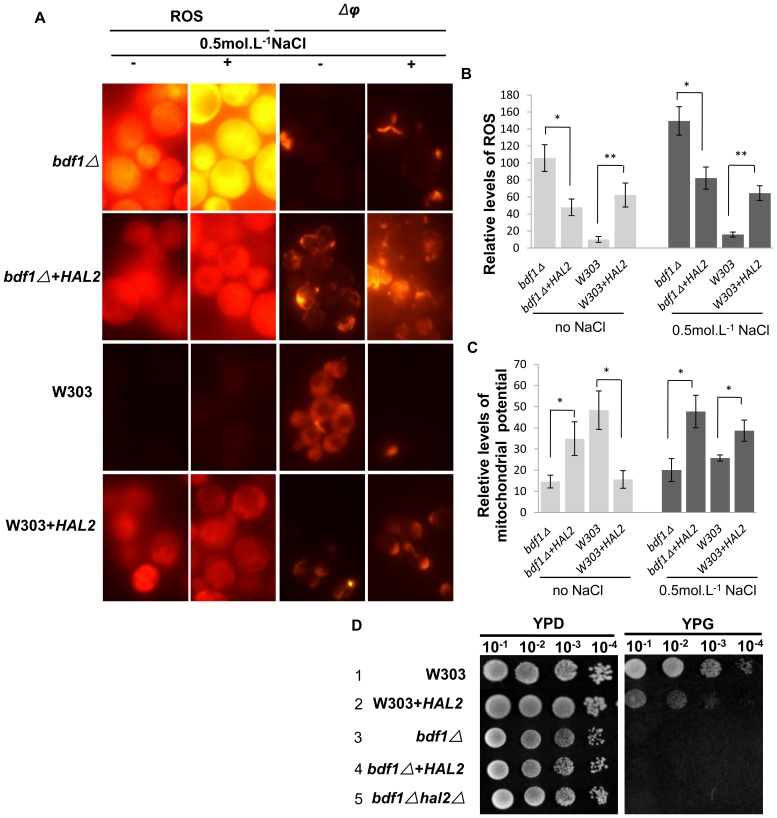
Figure 6. HAL2 overexpression affected ROS accumulation and partially affected the mitochondrial function.
Mid-log phase cells were incubated for 45 min with or without 0.5 mol.L−1 NaCl. ROS were detected by dihydrorhodamine 123. Mitochondrial membrane potential was measured with JC-1 (A) The ROS (B) and Δφ (C) fluorescence values were quantified as the relative fluorescence intensity per strain by ImageJ software and averaged from ∼50 cells. Error bars denote standard deviation (SD). *P<0.05, **P<0.01 vs. strains without HAL2 overexpression under the same treatment, n = 4. (D) 5 ul aliquots of 10-fold serial dilutions of the mid-log phage cultures were spotted onto YPG plates and incubated at 30°C for 3 d.

