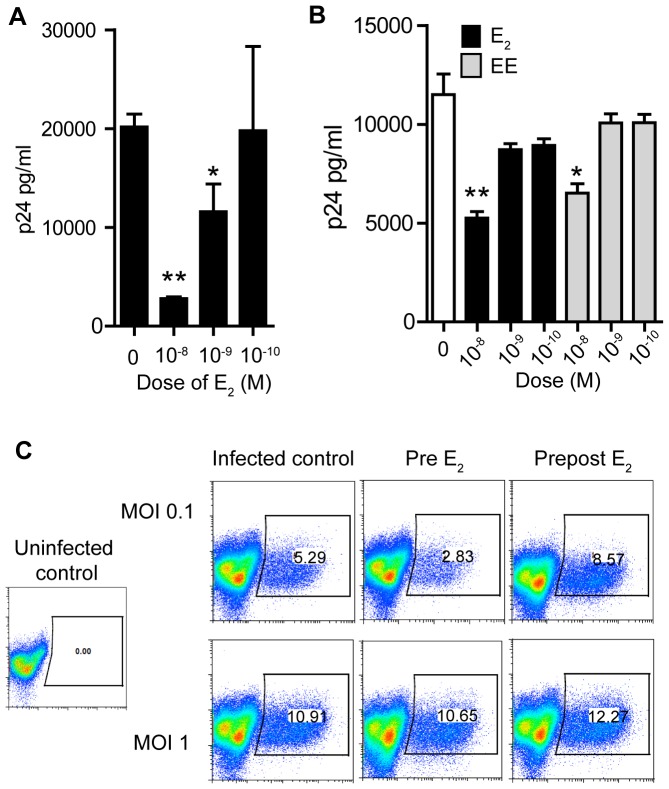
Figure 4. Dose response effect of E2 on HIV-infection.
A) Released p24 levels in the culture media after 7 days of infection when CD4+ T-cells where pre-treated with indicated doses of E2. Bars represent mean ± SEM from triplicates. Representative of 3 independent experiments with different donors. *P<0.05 **P<0.01. B) Released p24 levels in the culture media after 7 days of infection when macrophages where pre-treated with indicated doses of E2 (black bars) or EE (grey bars). Bars represent mean ± SEM from triplicates. Representative of 3 independent experiments with different donors. *P<0.05 **P<0.01. C) Percent of GFP positive cells after infection with HIV-GFP at MOI 1 or MOI 0.1 in CD4+ T-cells pre-treated with E2 (pre E2) or treated before and after infection (prepost E2).

