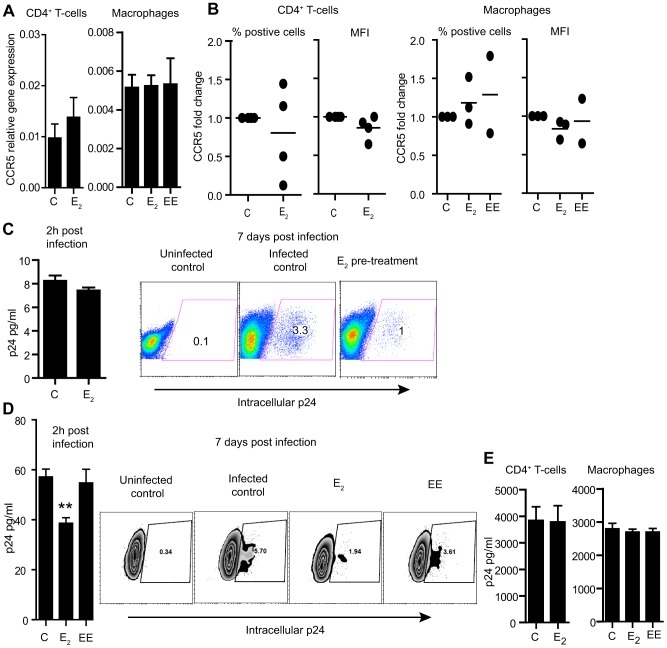
Figure 5. Effect of E2 on CCR5 expression and viral entry.
A) CCR5 expression by RT-PCR. Bars represent mean ± SEM from 4 different donors. B) Surface expression of CCR5 after treatment with E2 or EE compared to control. C) p24 detection in cell lysates from CD4+ T-cells 2 h after infection (N = 4) and intracellular p24 expression 7 days after infection. D) p24 detection in cell lysates from macrophages 2 h after infection (N = 3) and intracellular p24 levels 7 days after infection. E) Released p24 in the culture media 3 days after infection with VSV-G pseudotyped HIV. Bars represent mean ± SEM from 4 independent experiments with CD4+ T-cells and 3 with macrophages from different donors.

