
Figure 6. Effect of E2 on CCR5 ligand secretion.
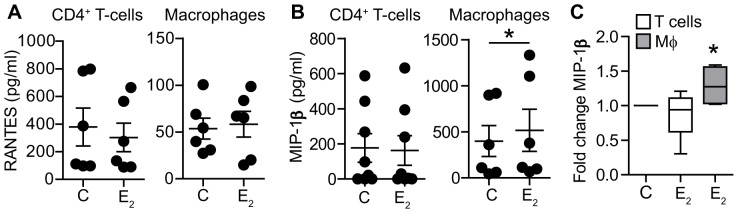
A) Levels of RANTES detected in the culture media from CD4+ T-cells (N = 6) and macrophages (N = 6) 3 days after infection with HIV-BaL. B) Levels of MIP-1β detected in culture media from CD4+ T-cells (N = 8) and macrophages (N = 6) 3 days after infection with HIV-BaL. Each dot represents a different donor. C) Box plot of normalized levels of MIP-1β in E2-treated CD4+ T-cells (white box) and macrophages (grey box) as compared to the control. Whiskers represent maximum and minimum values. *P<0.05.