
Figure 3. Successful over-expression of miR-449a in CL1-0.
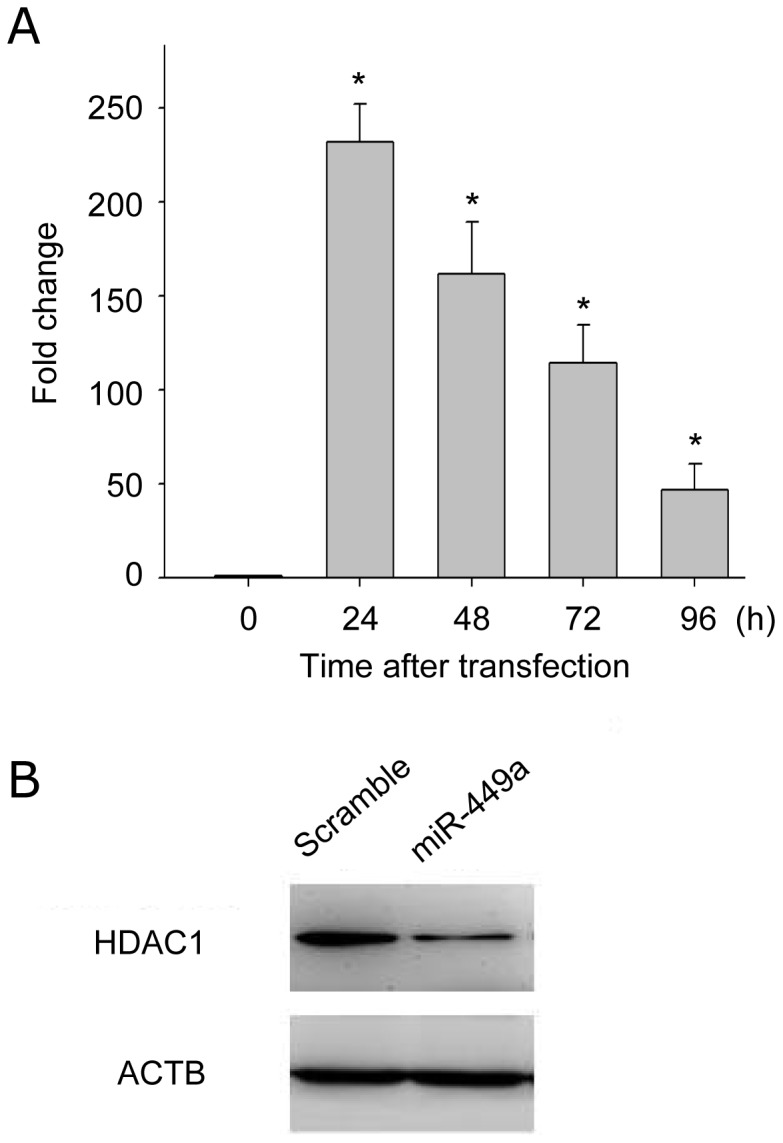
(A) Expression profiling of miR-449a over-expressed in CL1-0. Relative expression levels of miR-449a in CL1-0 cells were measured at indicated time points by real-time PCR after transiently transfected with miR-449a expression plasmid. RNU44 served as an endogenous control. Each measurement was made in triplicate. *: P<0.001. (B) Immunoblotting of histone deacetylase 1 (HDAC1), a validated target of miR-449a. Protein levels of HDAC1 in CL1-0 were analyzed 72 h after transfection. ACTB (β-actin) was a loading control.