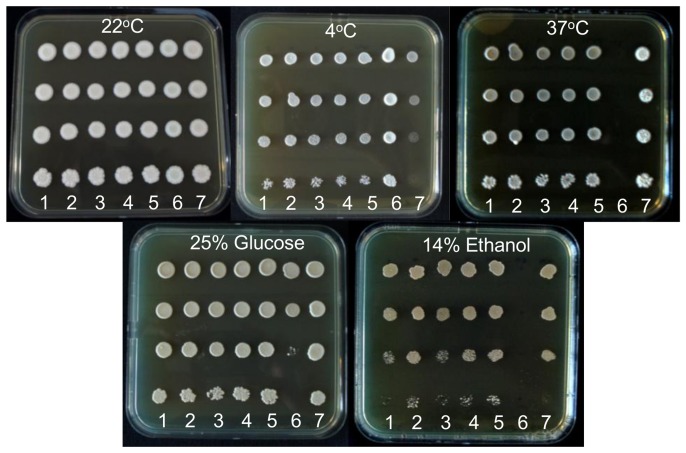
Figure 4. Phenotypic assessment assay plates.
Top row plates left to right; YEPD at temperatures 22°C, 4°C and 37°C. Bottom row plates left to right; YEP 25% glucose, YEPD 14% ethanol. Strains are plated in columns at 10 fold serial dilutions from top to bottom; columns 1–5 CxM5-CxM1 in descending order, column 6 NCYC2888, column 7 AWRI838.

