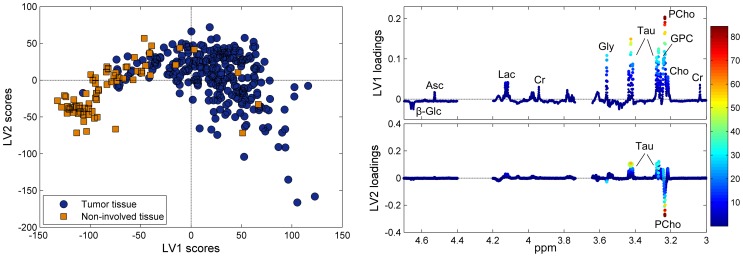
Figure 3. PLS- DA classification of tumor and non-involved tissue.
(A) The score plot, separating tumor and non-involved tissue, and (B) the corresponding loading profiles of LV1 and LV2. LV1 and LV2 explain 35.8% and 13.2% of the x-variation and 53.3% and 4.9% of the y-variation, respectively. β-Glc, β-glucose; Asc, ascorbate; Lac, lactate; Cr, creatine; Gly, glycine; Tau, taurine; GPC, glycerophosphocholine; PCho, phosphocholine; Cho, free choline.

