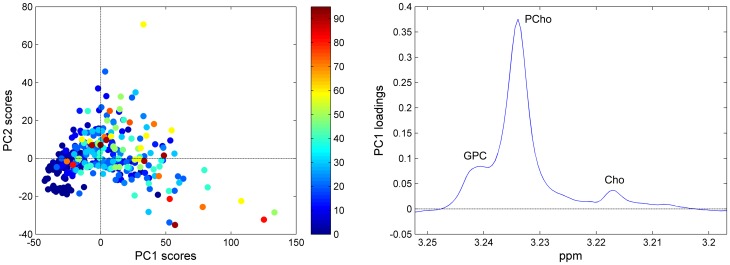
Figure 4. Variation in tumor cell content as described by PCA of the choline region.
(A) The score plot of the choline-containing metabolite region of the spectra, colored according to the tumor cell content (%) of the corresponding biopsies. (B) The corresponding loading profile of PC1 explaining 71.3% of the total variation of the data.

