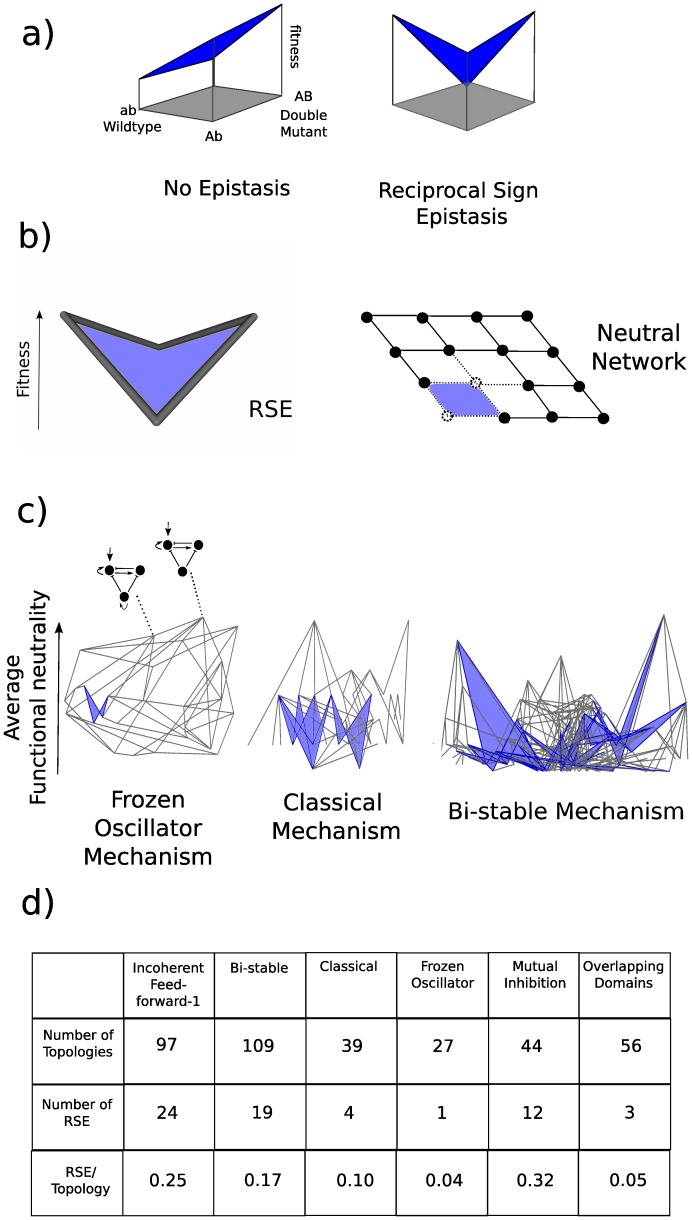
Figure 1. Epistasis and neutral networks.
a) Illustrating reciprocal sign epistasis. When there is no epistasis the combined effects of two mutations are the result of the addition of the fitness effect of each individual mutation. There is reciprocal sign epistasis when the two individual mutations negatively affect fitness yet the double mutant is fitter than the combination of individual mutations. Figure adapted from [15]) b) Illustrating how reciprocal sign epistasis causes the irregularity in the shape of a neutral network. Dots are viable genotypes and edges connect genotypes equal except for one mutation. We assume the two unfit genotypes in an RSE geometry are unviable (dashed dots) and the two fit genotypes are viable. Therefore RSE will be responsible for the gaps in neutral networks that lead to the irregular shape (loss of the dashed edges and dots in the neutral network shown). c) Examples of average functional neutrality landscapes for 3 gene regulatory network mechanisms capable of interpreting a morphogen gradient. Topologies are vertices and single mutant neighbors are connected via edges (as illustrated by the two topologies in the Frozen Oscillator average functional neutrality landscape). Topologies are spaced in the y-axis according to their average functional neutrality (fraction of viable parameter space capable of performing the morphogen interpretation function) and in the x-axis to reduce edge-crossing. Mutant neighborhoods where statistically significant RSE exists are colored blue. d) The number of topologies and the incidence of RSE for each of the different mechanisms. The amount of RSE normalized to the number of topologies in the landscape can be found on the bottom row.

