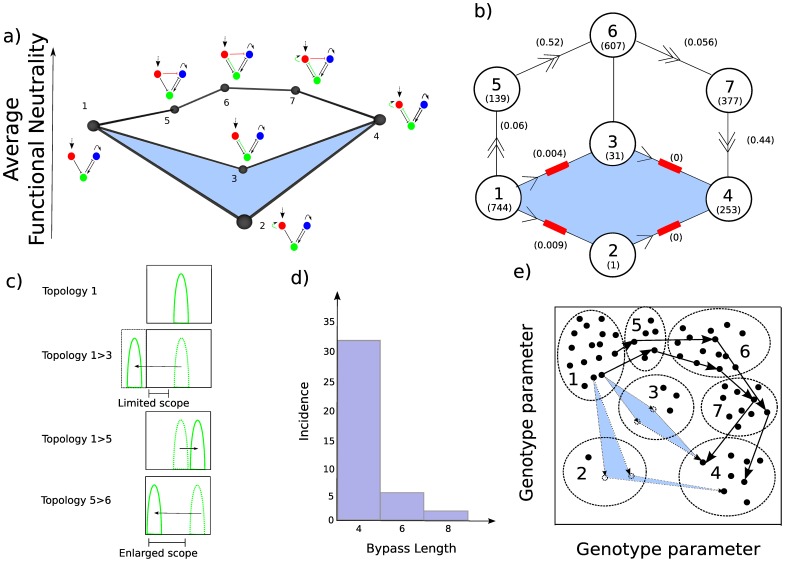
Figure 3. Permissive mutations allow RSE to be bypassed.
a) The same example of RSE from figure 2 with an extra-dimensional bypass. The addition of a permissive mutation (red interaction in topology 5) before the original individual mutations are added (green interactions in topologies 6 and 7) allows the topology to retain a high average functional neutrality. The permissive mutation can then be removed (7 to 4) resulting in a bypass of the RSE. b) A scheme adapted from Ortlund et al., (2007) highlighting the similarity of permissive mutations in gene regulatory networks and in enzyme sequence-function relationships [14]. Topologies are shown in the circles. Large numbers in the circles represent the topology number and the number in the bracket is the number of functional parameter sets for that topology (i.e. the average functional neutrality; note that this was measured after the 7 topologies were re-simulated with a million parameter sets). The numbers on the edges represent the probability of a mutation of one of the successful parameter sets being functional when changed to the next topology when stepping through parameter space (in the direction of the arrows; see Methods). Non-viable steps are shown as red blocks (defined by a chance of less that 1%) and viable steps are shown by double headed arrows. c) The permissive interaction is caused by opposing effectors of differing strength. A typical mutation from a genotype with topology 1 to a genotype with topology 3 will significantly shift the stripe of gene expression to the left (second panel). The majority of these mutations leave the stripe outside the spatial field as defined by the morphogen gradient and therefore they are not functional. The mutation of a genotype with topology 1 to a genotype with topology 5 on the other hand typically shifts the stripe to the right and by a much smaller amount than the 1>3 shift (see main text). Therefore many more of the 1>5 transitions are viable. Because many more of the genotypes that correspond to topology 5 have their stripes at the extreme of the spatial domain, there is now more scope to introduce the green inhibition of topology 3. There is more space to shift the stripe by introducing this interaction and still result in a functional stripe. d) A histogram of the extra-dimensional bypass lengths between pairs of topologies in RSE. e) An illustration of how an average functional neutrality landscape can be envisaged as a density map of functionally neutral genotypes and how our measure of RSE and bypasses using topology is an underestimate. The Axes are genotype parameters. In reality there are 3 dimensions for the 3 interactions added between topology 1 and 7 but here we have reduced to 2 for simplicity. Black dots represent functional genotypes (topology with specific parameter set) and dashed dots represent non-functional genotypes. Large dashed circles represent the topologies (numbers) to which those genotypes map. Multiple different RSE and extra dimensional bypasses between topology 1 and 4 are shown by the light blue RSE geometry and the paths of solid black arrows respectively.

