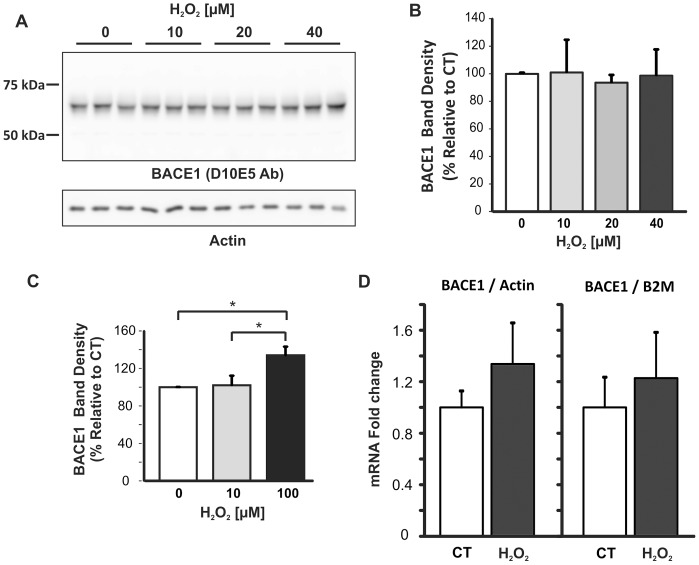
Figure 2. Analysis of BACE1 expression in primary neuronal cultures after mOS treatment.
A. Representative BACE1 immunoblot. Cell lysates (15 µg/lane) were subjected to SDS-PAGE on 8.5% Tris-Glycine gels, followed by immunoblotting with D10E5 rabbit monoclonal antibody that targets BACE1 C-terminal region. Blots were re-probed for actin. B. Densitometry analysis of blots from three individual experiments. BACE1 signal density was normalised to actin. No statistical difference was found between treated and control cells. C. Densitometry analysis of BACE1 blots. BACE1 signal was significantly increased in cells treated with 100 µM H2O2 compared to untreated cells or cells treated with 10 µM H2O2. Data were analysed by One-way ANOVA, and the Games-Howell post-hoc test. Error bars represent standard deviation. D. RT-qPCR analysis of BACE1 mRNA. 2 µg of RNA was used for first strand synthesis and the resulting cDNA (1 ng) subjected to quantitative real-time PCR. Levels of BACE1 mRNA transcripts were calculated using the comparative CT method relative to either actin or β2-macroglobulin (B2M) housekeeping genes. qRT-PCR assays were carried out in triplicate. Data represent average data of two independent treatments carried out in triplicate. Error bars represent range of the fold-differences, determined by incorporating the standard deviation of the ΔΔCT value into the fold-difference calculation.

