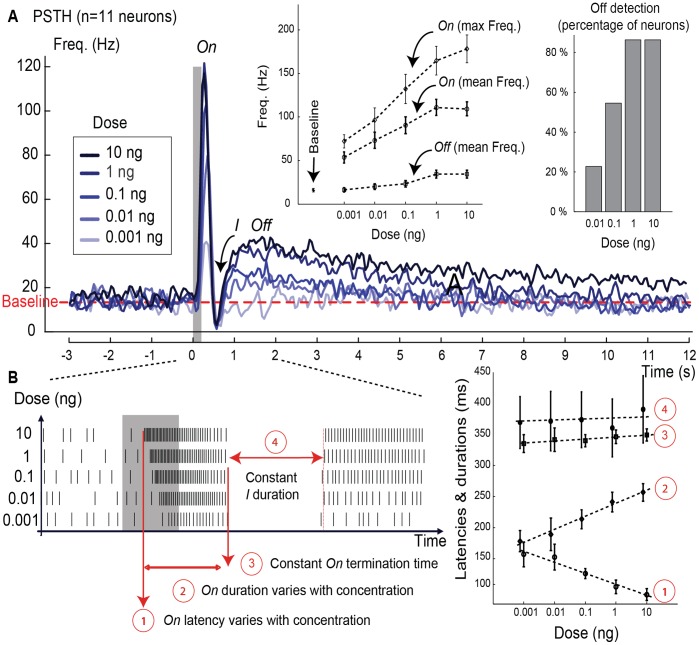
Figure 1. Dose effect on response frequencies and latencies.
(A). Peristimulus time histogram (PSTH) built using 11 neurons and a sliding window of 100 ms (50 ms overlap). The grey bar indicates the stimulus (pheromone blend of 200 ms at 5 different doses, from 0.001 to 10 ng). The dotted line represents the baseline activity (mean frequency). Figure inset at the left shows the On and Off firing frequencies at different doses (mean±s.e.m., n = 11 neurons). The Off frequency was estimated by averaging over a one-second signal after the inhibitory phase. The On frequency (mean and max) was estimated using the complete On phase after stimulus onset. The value reported as baseline is the mean frequency of the spontaneous activity. At the lowest dose, Off and baseline have similar mean frequencies. Figure inset at the right shows that the percentage of the Off phase detected in the neural response increased with the dose (n = 43 neurons). The presence of the Off was identified with the same segmentation method described for the On in Text S1. (B). Effect of the dose on the latency and duration of the On and I phases (mean±s.e.m., n = 11 neurons). The On latency decreased as the logarithm of the dose. The On duration increased as the logarithm of the dose. The I duration did not change with the dose.

