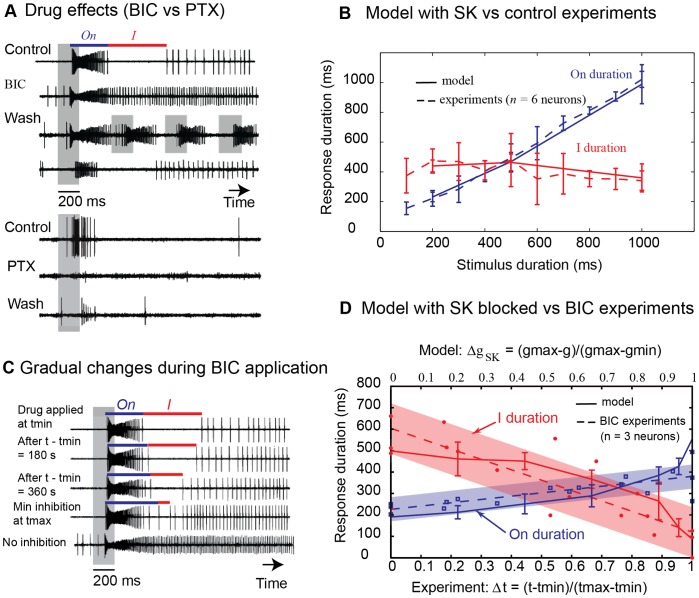
Figure 3. Pharmacological manipulations and neuron model.
(A) Effects of bicuculline (BIC) and picrotoxin (PTX). Data are shown as raw traces. The stimulus (200 ms) is indicated by a grey bar. With BIC application (100 µM), the inhibitory phase was abolished so that the response to the pheromone changes from multiphasic to monophasic (n = 3 neurons). After wash-out, the multiphasic responses were recovered, as well as the ability to encode pheromone pulses. With PTX (100–250 µM), firing was suppressed during the spontaneous activity and the response to the pheromone (in 6 out of 7 neurons). The multiphasic responses were partially recovered after wash-out. (B) Simulation of the neuron model with SK versus control experimental data (dashed lines). On/Off neurons (n = 6) were recorded for different stimulus durations (100 ms to 1 s, a single puff of the pheromone blend at 1 ng). The On duration depended linearly on stimulus duration: On duration = 0.99×(stimulus duration) +18 ms (Pearson correlation r2 = 0.97). The inhibitory phase was constant (p = 1, Kruskal–Wallis test): I duration = 399±106 ms. The neuron model (Text S1) was simulated with inputs mimicking a 1 ng pheromone blend stimulus (200, 500 or 1000 ms duration; 10 runs in each condition), resulting from fits of experimental data recorded in olfactory receptor neurons in vivo [12]. (C) Time dependent effect of BIC. Pheromone responses are shown at different times after BIC application (data as raw traces from the same neuron, stimulus (grey bar) = 200 ms). tmin indicates the start of BIC application (100 µM) and tmax indicates the time right before the inhibitory phase vanishes completely. (D) Simulation of the neuron model with SK blocked versus BIC experimental data. Data points represent On and I duration measured during BIC experiments (n = 3 neurons, stimulus duration = 200 ms), plotted versus the normalized time of BIC application (Δt at bottom axis, with tmin and tmax defined as in panel C). Dashed curves are linear fits of the data where blue and red envelopes show the 50% confidence bands. Plain curves represent On and I durations measured from simulations with partially blocked SK conductance. The durations of the two phases were plotted versus the normalized decrease in SK-like conductance (ΔgSK at top axis, with g ranging from gmin = 0.05 µS to gmax = 0.5 µS).

