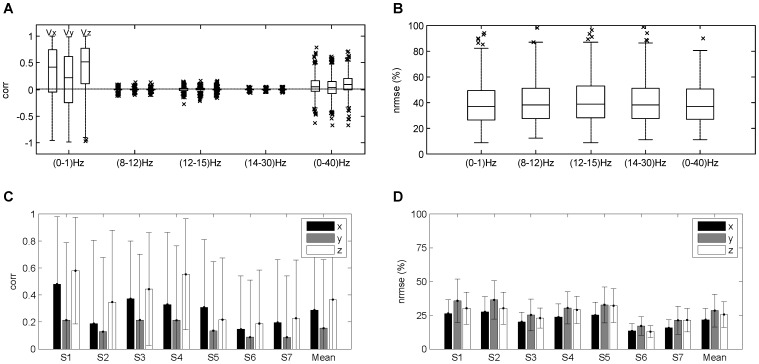
Figure 5. (A,B) Distributions of  and
and  for all participants for decoding models evaluated with EEG in the very low
  (0–1) Hz,
  (8–12) Hz,
  (12,15) Hz,
  (14–30) Hz and (0–40) Hz frequency bands.
In the  ,
,  and
and  frequency bands, the distributions of
  have a significant zero-median distribution in X-, Y- and Z-dimension of the velocity. For the very low
  and the (0–40) Hz frequency bands the distributions of
  were positive and significantly different from zero, although the medians of the distributions obtained in the very low
  are notably higher than for the (0–40) Hz band. These results support the selection of the very low
  band to further study the decoding of hand velocity. (C,D) Decoding results using the very low
  (0–1) Hz frequency band. mean
 std values of
  and
and  in the decoding of hand velocity profiles using the very low frequency band for all participants plus overall mean.

