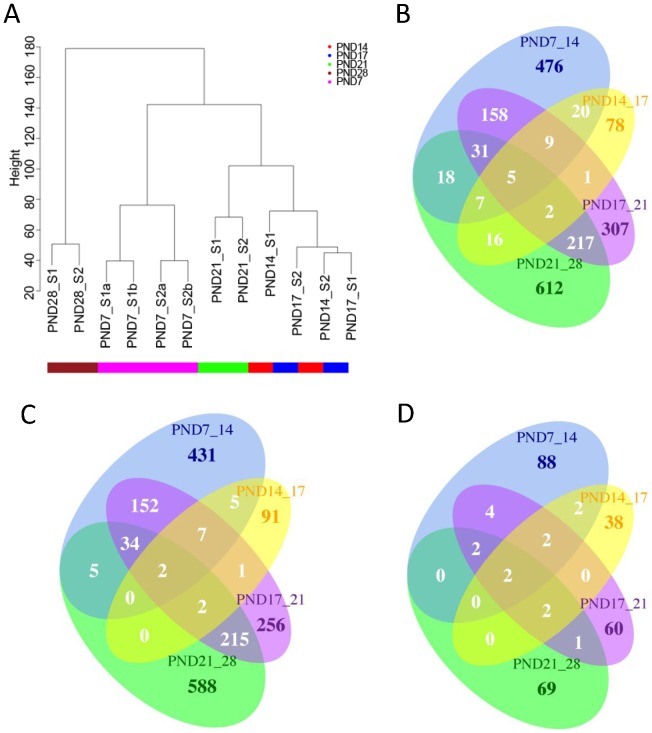
Figure 1. Clustering of sample groups and overlapping DE genes.
A. Hierarchical clustering for the normalized data. Biological replicate samples cluster closely together. Sample groups PND28 and PND7 are more distant to other groups and PND14 and PND17 are similar to each other based on the gene expression differences. B. Total number of overlapping DE genes between comparisons. C. Agreeing and overlapping upregulated genes between comparisons. D. Agreeing and overlapping downregulated genes between comparisons.

