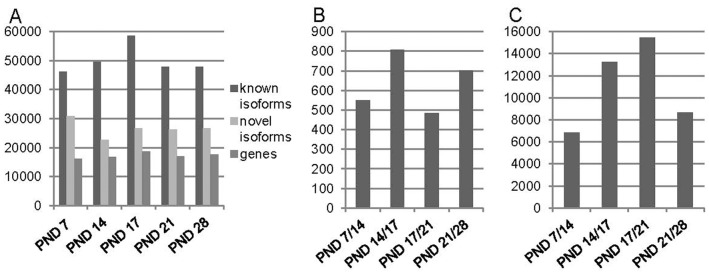
Figure 5. Gene and isoform counts and promoter and transcription start site usage in sample groups.

A. Expressed gene, known and novel isoform counts at different time points during the first wave of spermatogenesis. FPKM >1. B. Differential promoter usage in all sample group comparisons. C. Differential transcription start site usage between all sample groups. The comparisons in chronological order during the first wave of spermatogenesis are indicated in black (B and C).
