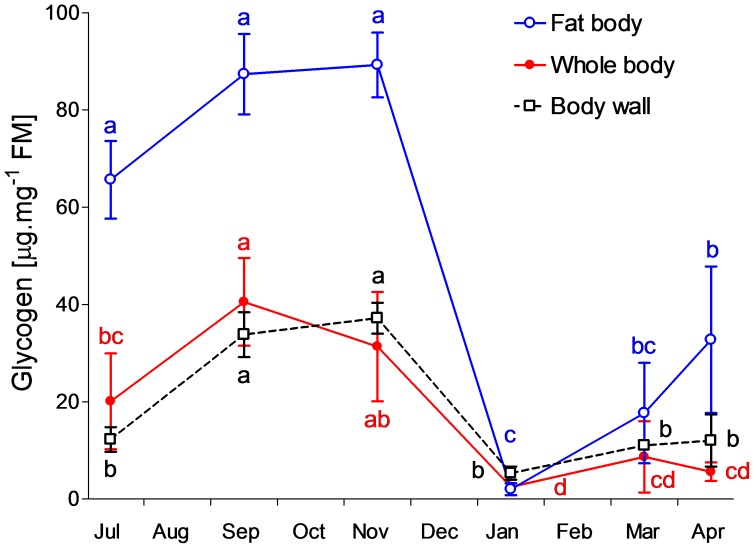
Figure 2. Glycogen.
Seasonal whole-body and tissues changes of glycogen contents in field-sampled caterpillars of Cydia pomonella during 2010/2011. Each point is the mean ± S.D. (whole body, n = 5 individuals; tissues, n = 3 replicates, 3 individuals each). Influence of sampling date on glycogen content was tested by ANOVA followed by Bonferroni's post hoc test (means flanked with different letters are significantly different).

