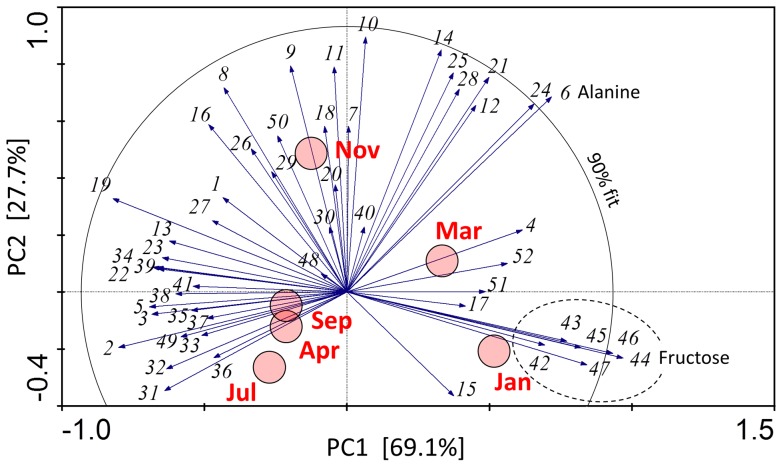
Figure 6. Hemolymph metabolom.
Principal component analysis showing the association between sampling date (red circles) and the concentration of 52 different metabolites (eigenvectors) in the hemolymph of field-sampled caterpillars of Cydia pomonella during 2010/2011. The numbers coding for metabolites are decoded in Dataset S1. The eigenvectors of alanine (6), fructose (44), and mannitol (46) extend beyond the circle delimiting 90% fit of the model. The metabolites (42–47) most characteristic for winter (January) sample are enclosed by a dashed line ellipse.

