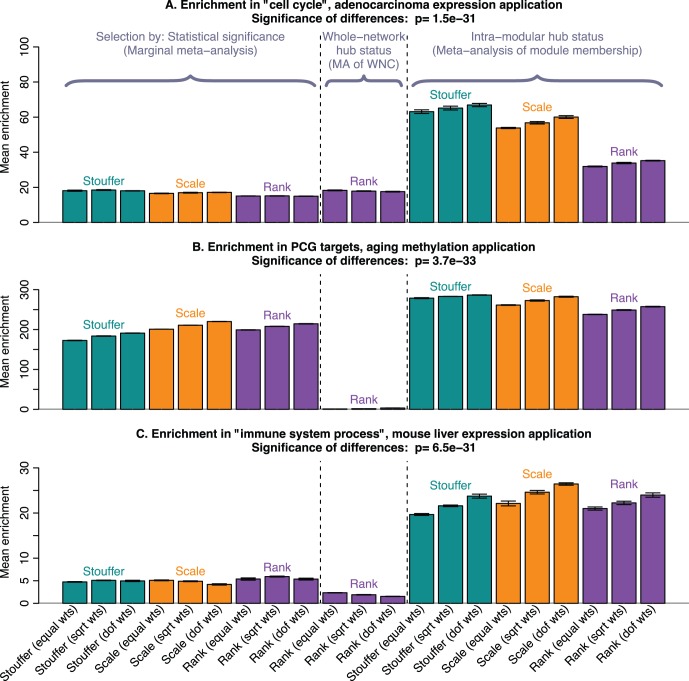
Figure 1. Meta-analysis of module membership leads to gene lists with stronger functional enrichment.
The 3 barplots show enrichment values, defined as negative  of the enrichment p-value,
  , in our 3 applications. Each bar summarizes the best enrichment values obtained by the corresponding meta-analysis method. Specifically, for each method we computed the enrichment in the corresponding “gold standard” list of genes. The enrichment was calculated in the top 20, 40, 60, …, 1000 genes in the adenocarcinoma and mouse TC applications; and in 100, 200, …, 5000 genes in the aging application. The best 20% of enrichment values were retained. Each bar represents the mean of these best enrichment values, and error bars give the corresponding standard deviations. The standard deviations are not corrected for auto-correlation of enrichment values. The Kruskal-Wallis test p-value is indicated in the title. The figure shows that meta-analysis of membership in consensus modules leads to gene lists with higher enrichment and hence better biological interpretability.

