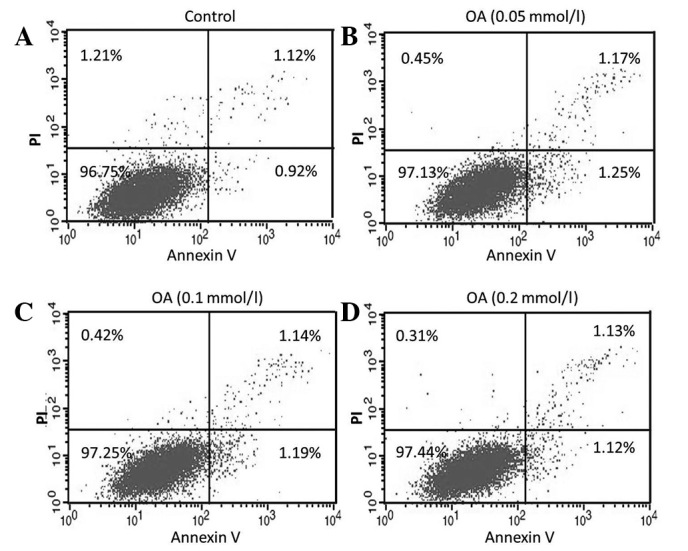
Figure 2.

Delayed apoptosis of 786-O cells by treatment of oleic acid. Cells treated with various concentrations of oleic acid were double-stained with annexin V and PI and analyzed by flow cytometry. The gate was set to distinguish between living (bottom left), necrotic (top left), early apoptotic (bottom right) and late apoptotic (top right) cells. *P<0.05; vs. the control group. OA, oleic acid; PI, propidium iodide.
