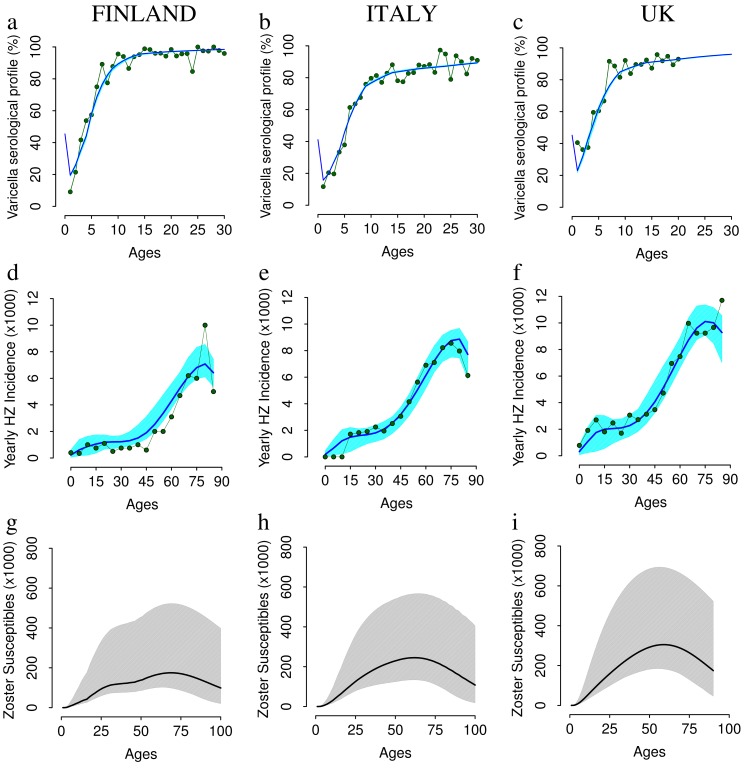
Figure 2. VZV seroprevalence, HZ incidence and boosting incidence in Finland, Italy and the UK.
Top Row. VZV seroprevalence by age as observed in [1] (in green) and as predicted by the model (average in blue, 95% CI in cyan) for Finland (a), Italy (b), UK (c). Mid Row. Yearly HZ incidence by age(cases per 1,000 individuals) as observed in [3], [23], [28] (in green) and as predicted by the model (average in blue, 95% CI in cyan) for Finland (d), Italy (e), UK (f); Bottom row. Predicted HZ susceptibility age profile for Finland (g), Italy (h), UK (i). Results are based on 1,000 model realizations.

