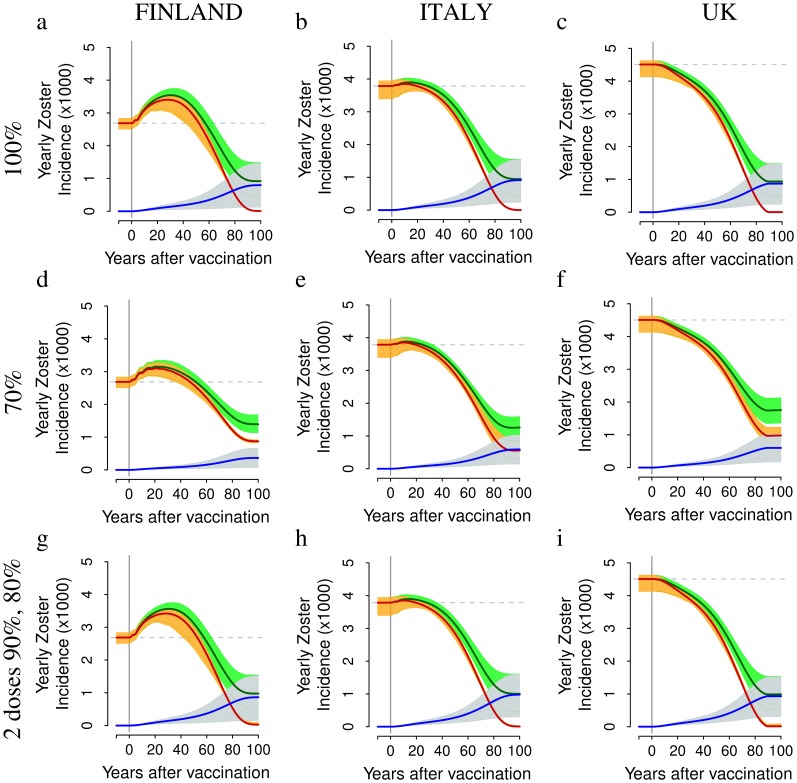
Figure 5. The impact of different vaccination schedules and coverages on HZ incidence.
Top row. Yearly incidence of HZ (average in dark green, 95% CI in light green), of natural HZ (i.e., HZ cases occurring among unvaccinated individuals that have experienced natural varicella (average in red, 95% CI in orange) and of HZ caused by the vaccine strain (average in blue, 95% CI in light blue) per 1,000 individuals as predicted by simulating a single vaccine dose administered to 1 year-old infants with 100% coverage in Finland (a) in Italy (b) and in the UK (c). Mid row. As the top row but obtained by considering 70% coverage in Finland (d) in Italy (e) and in the UK (f). Bottom row. As the top row but for the two-dose scenario, which assumes the administration of a first dose to 1 year-old individuals (90% coverage) and a second dose to 5 years-old individuals (80% coverage) in Finland (g) in Italy (h) and in the UK (i). Results are based on 1,000 model realizations.

