
Figure 1.
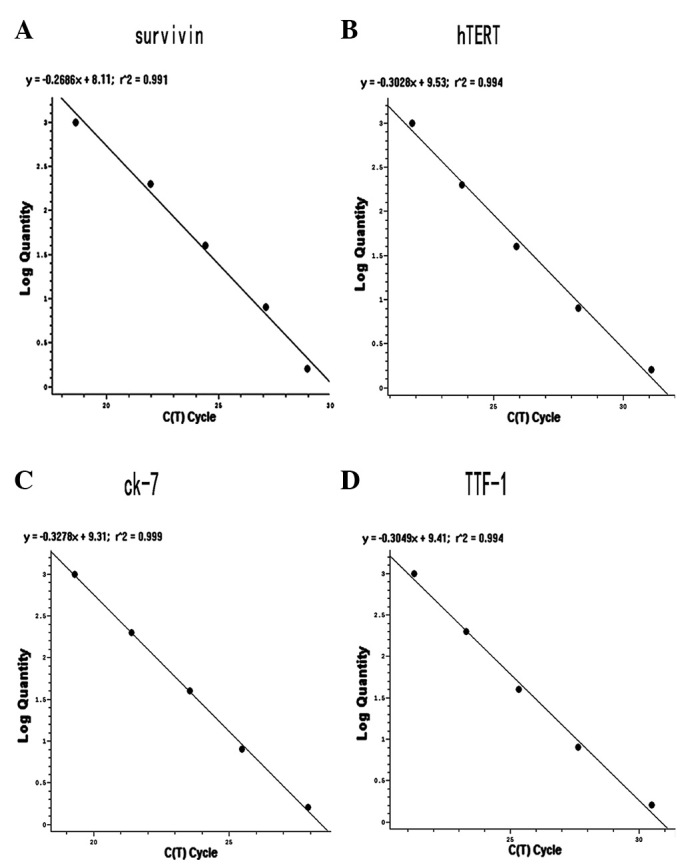
Standard curves for (A) survivin, (B) hTERT, (C) CK-7 and (D) TTF-1 estimation. Each curve was constructed using data from five external standards by plotting the Ct value against the input quantity of A549 cells (the concentration is 10,000 cells/5 ml, 1,000 cells/5 ml, 100 cells/5 ml, 10 cell/5 ml and 1 cell/5 ml. The concentration is represented from top to bottom in each figure) of the four markers. hTERT, human telomerase reverse transcriptase; TTF-1, thyroid transcription factor 1; CK-7, cytokeratin-7; Ct, threshold cycle.