Figure 3.

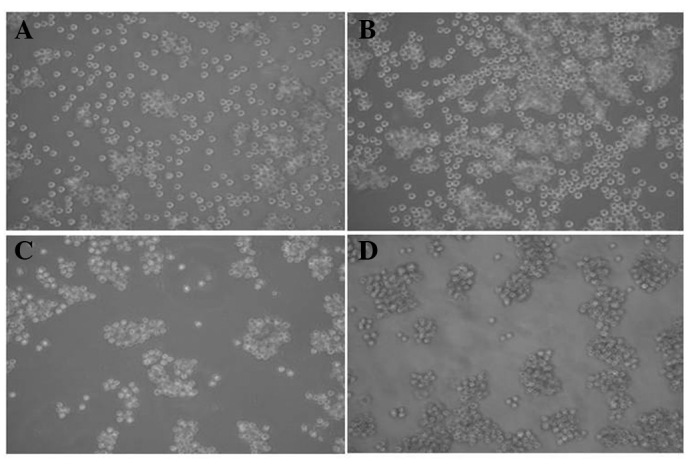
Morphology of K562 cells after transfection with ICN2 under inverted phase contrast microscope (ICC, ×400. (A) and (B) K562-blank group at 24 and 48 h; (C) and (D) K562-ICN2 group at 24 and 48 h.

Morphology of K562 cells after transfection with ICN2 under inverted phase contrast microscope (ICC, ×400. (A) and (B) K562-blank group at 24 and 48 h; (C) and (D) K562-ICN2 group at 24 and 48 h.