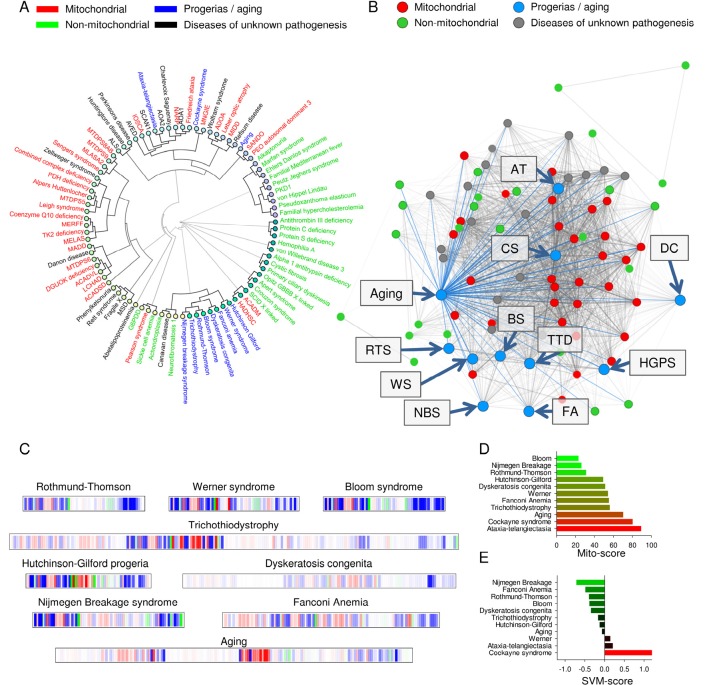
Figure 3. Normal aging and some accelerated aging disorders display phenotypical similarities to mitochondrial diseases.
(A) Clustermap using uncentered similarity and average linkage of all the diseases in the database. Blue represents aging and the accelerated aging disorders. (B) A representation of how aging and the progerias (blue dots) associate within the disease network. (C) Mitochondrial barcode of some accelerated aging disorders. (D) The mito score of the tested diseases. (E) The SVM score of the tested diseases.

