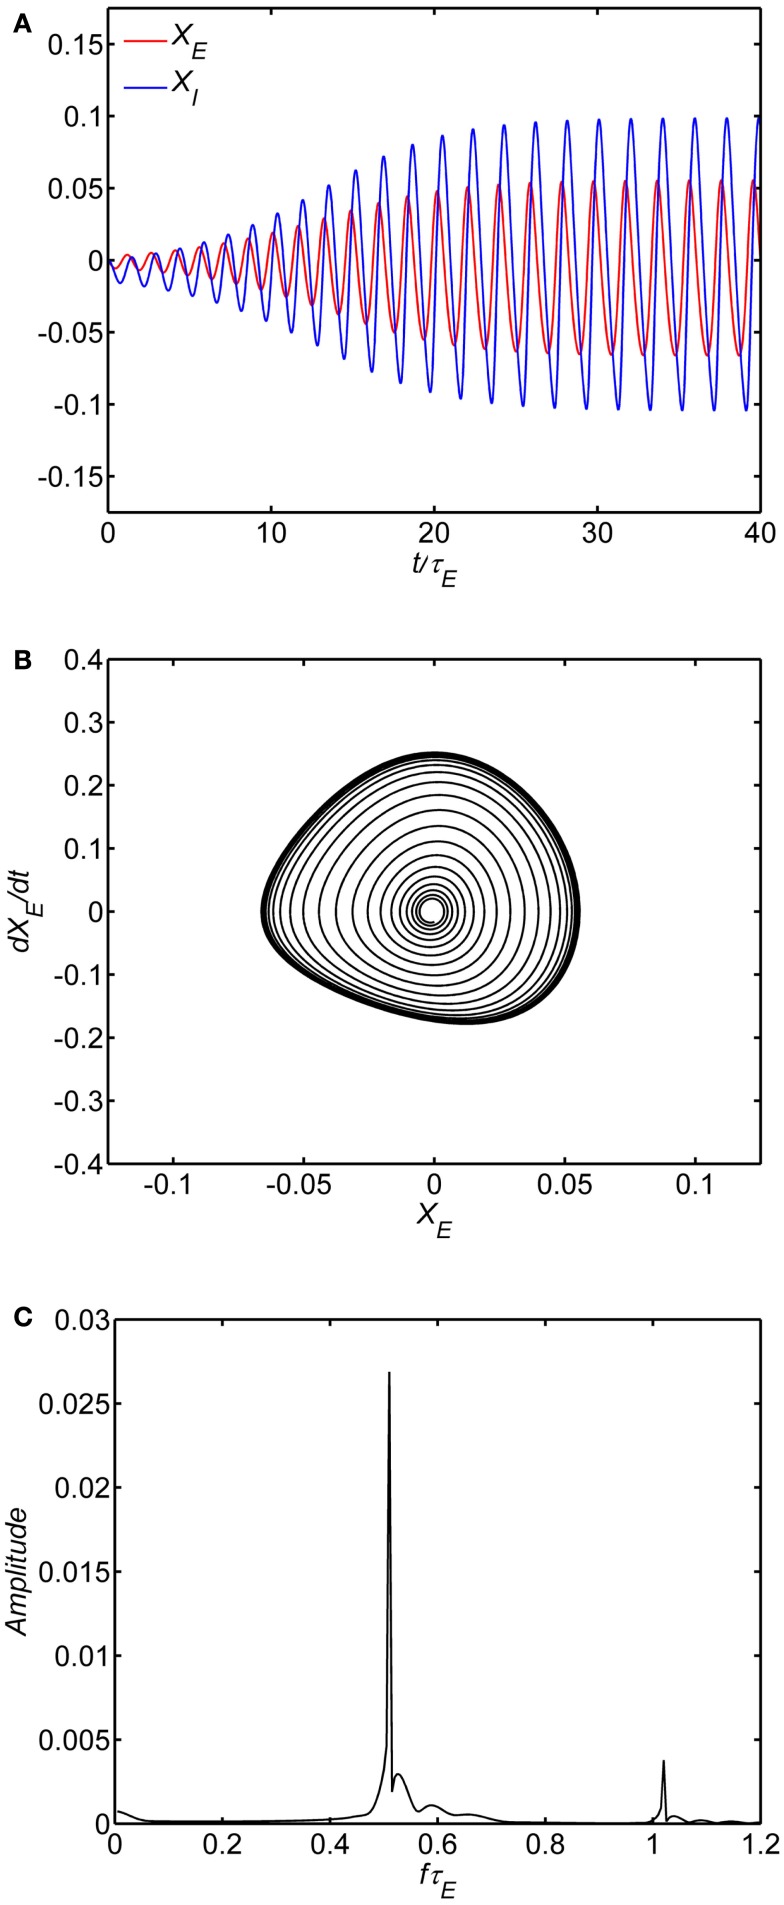
Figure 3.
Limit cycle regime of the model. In all of the simulations, the following parameters are fixed: (1) The ratio of time constants A = τI/τE = 1, (2) the background state E0(t) = I0(t) = 0.25, (3) the connection weights are (wEI, wIE, wII) = (50,15,0) and (4) the input P(t) = 0.1 is a step function at time 0. Limit cycle oscillation observed with self-excitation wEE = 20. The time series of the excitatory and inhibitory subpopulations are shown in (A). In these plots time is normalized by excitatory membrane time constant τE. Phase-plane plots for the excitatory subpopulation are shown in (B). Amplitude spectra obtained by the FFT are shown in (C). Normalized frequency is fτE. If τE = 20 ms, a normalized frequency of 1 corresponds to 50 Hz.

