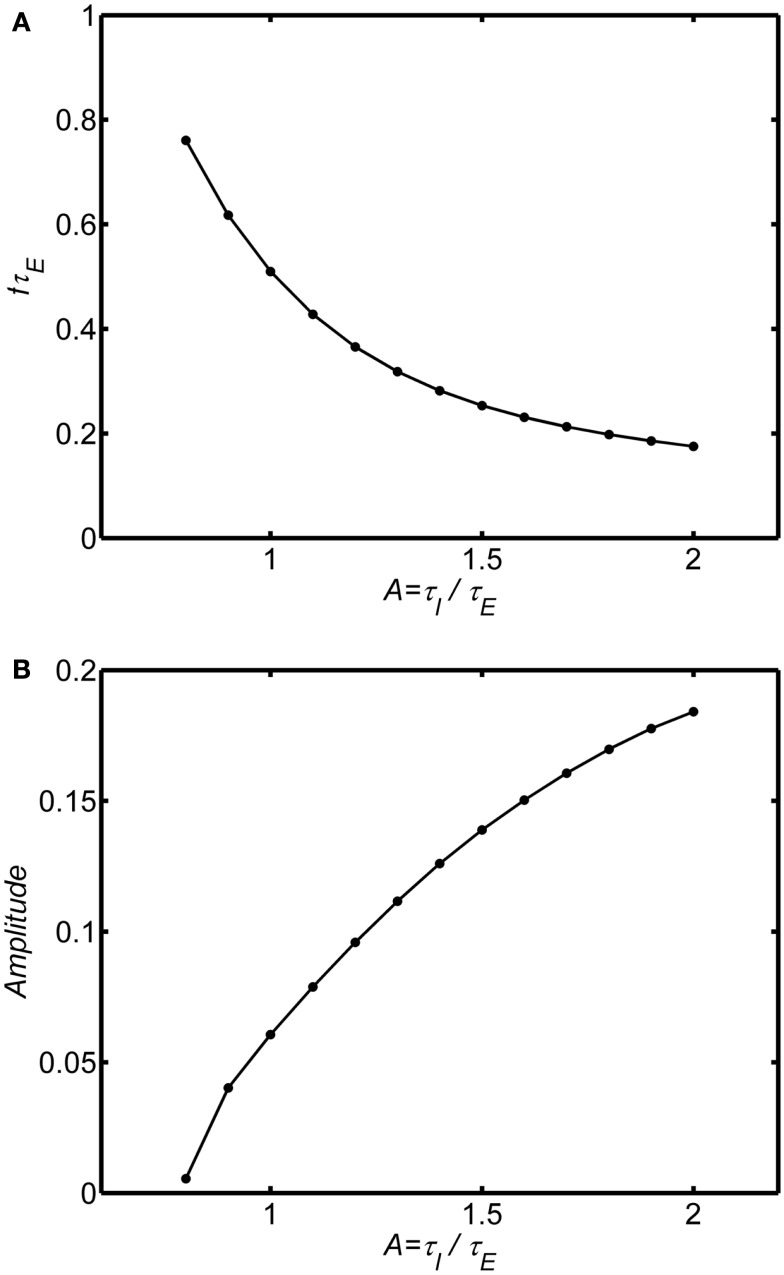
Figure 5.
Effect of the ratio of inhibitory to excitatory time constants in the limit cycle regime. The background state is fixed as E0(t) = I0(t) = 0.25. Input is a step function of magnitude P(t) = 0.1. System connection weights are fixed as (wEI, wIE, wII) = (50,15,0) and wEE = 18 to fix the system in the limit cycle regime. Frequency and amplitude estimated using a Hilbert Transform of the period from of 100τE to 200τE. Normalized frequency is fτE. If τE = 10 ms, normalized frequency of 1 is 100 Hz. For A smaller than the range shown for each plot the limit cycle transitions to a damped oscillation. The main result is that increasing τE relative to τI reduces damping (increasing amplitude) and lowers the frequency of the oscillation. (A) Normalized frequency (B) Amplitude.

