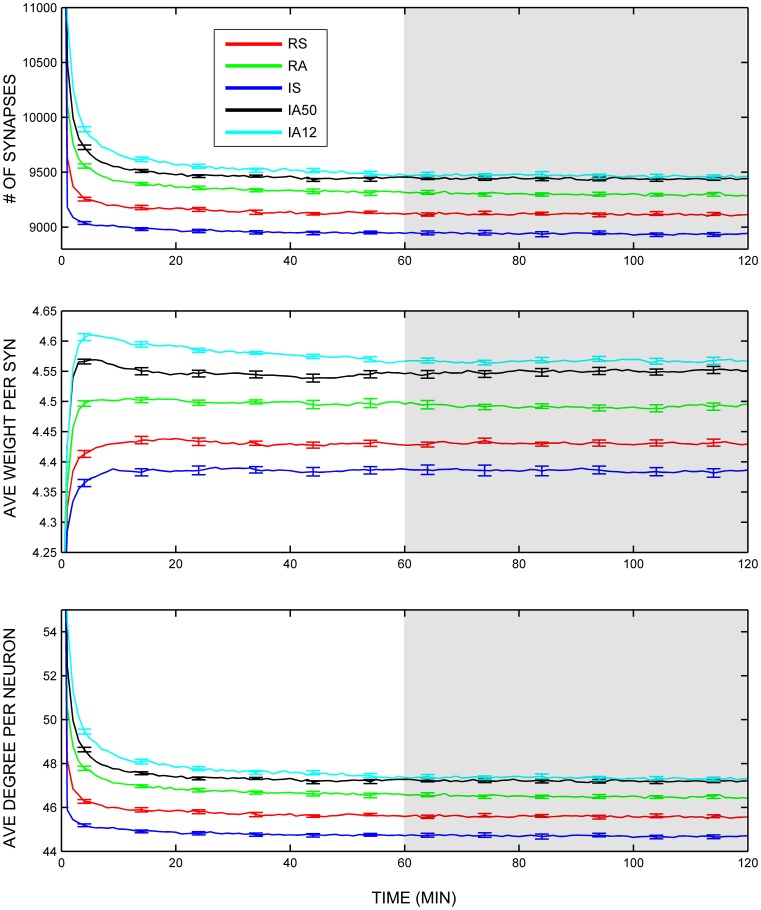
Figure 3.
Global variables. Trajectories of total number of excitatory synapses (top), average synaptic weight (middle), and average total neuronal degrees (bottom) across the entire simulation duration. Colored lines represent responses to separate external input regimes averaged across 10 simulations. Error bars represent S.E.M. across each of the 10 simulations at that timepoint. Shaded area represents analysis interval. Note that each input regime started with that same initial number of synapses (mean = 15,991.80), weights (mean = 4.00 Hz), and degrees (mean = 79.96) although they exceed the range of the graphs.

