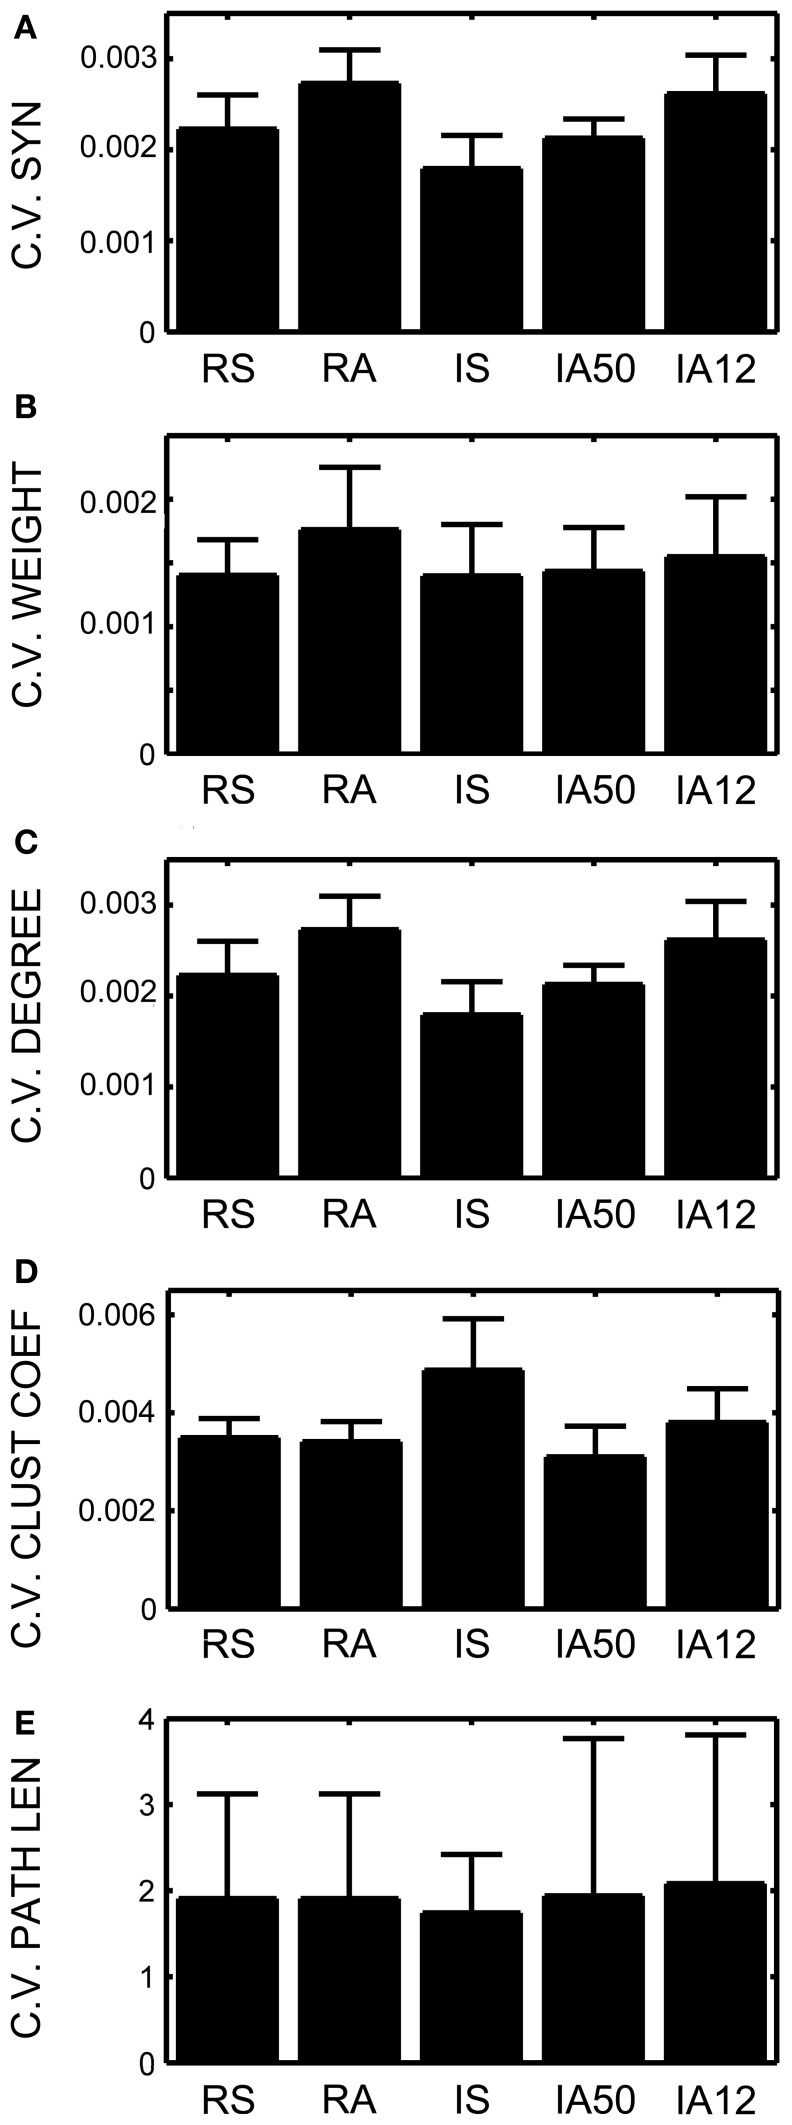
Figure 4.
Coefficients of variation across time. Coefficients of variation (the standard deviation across time divided by the mean) for (A) Total number of excitatory synapses, (B) Average synaptic weight, (C) Average total neuronal degrees, (D) Average weighted and directed clustering coefficient, and (E) The average weighted and directed path length. Error bars represent SD's across the 10 simulations for each input regime.

