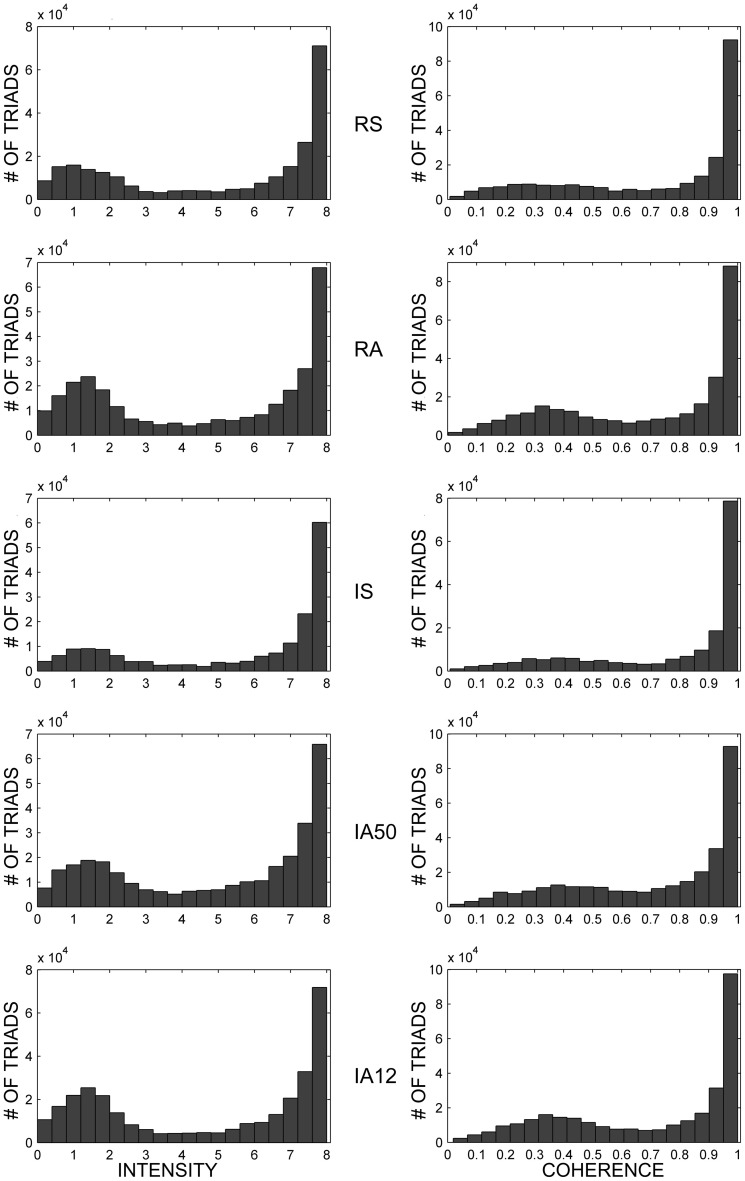
Figure 6.
Dynamic triad intensities and coherences. Exemplar dynamic triad intensity (left) and coherence (right) distributions in response to separate external input regimes. All examples are from the same initial network. Note that triad counts (ordinate axes) are not on the same scale for all input regimes, and all intermediate ordinate values are scaled by a factor of 10−4.

