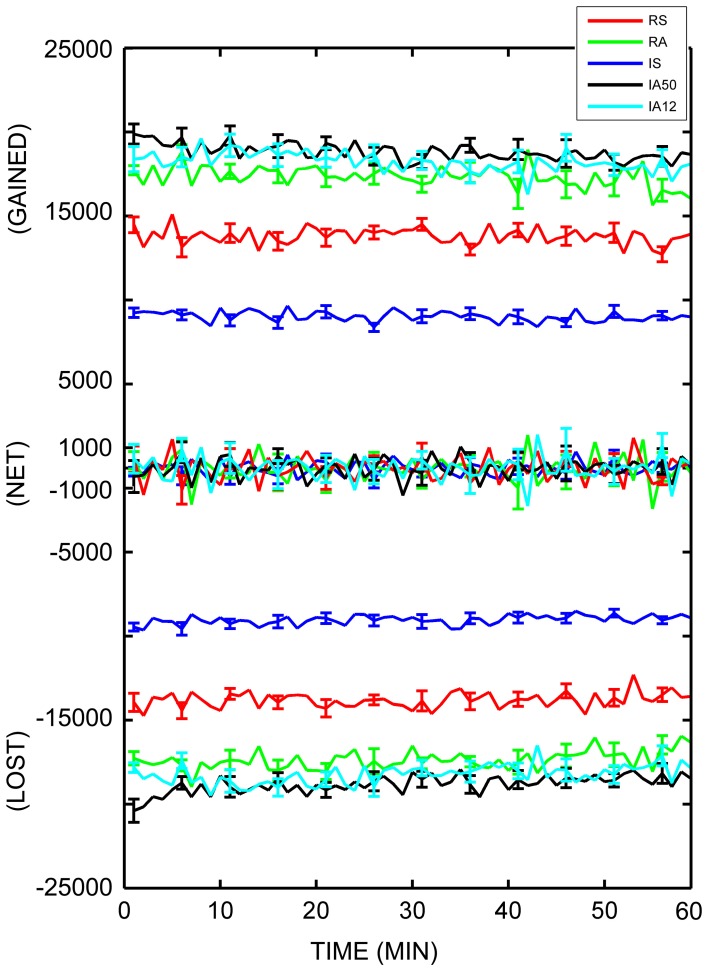
Figure 7.
Dynamic triad trajectories. Average number of dynamic triads gained, lost, and net triad number differences for each minute in the analysis interval. Each minute (abscissa) represents the difference between that minute and the following minute. The number of individual triads (ordinate axis) is separated into “gained,” “net,” and “lost” for clarity. Colored lines represent responses to separate external input regimes averaged across 10 simulations. Error bars represent S.E.M. across each of the 10 simulations at that timepoint.

