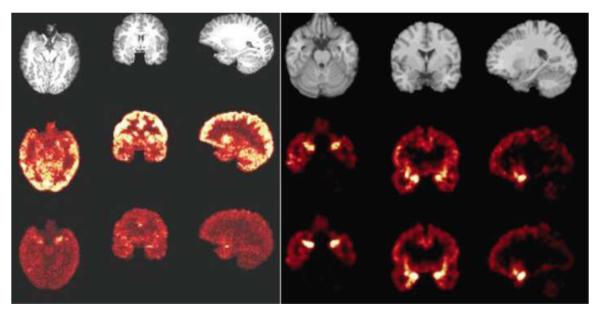
Fig. 4.
MRI scans and positron emission tomography (PET) images of kappa opiate receptors in the brain of a healthy individual. For both left and right panels, the left column shows the axial slice, the middle column shows the coronal slice and the right column shows the sagittal slice. The PET images of the receptors confirm their known distribution in the human brain, with high levels in a circuit implicated in post-traumatic stress disorder, which includes the amygdala, hippocampus and ventromedial prefrontal cortex. Left panel: Top row: MRI images. Middle row: 0–10 min summed PET image. Bottom row: 60–120 min summed PET image. Right panel: Top row: MRI images. Middle row: corresponding binding potential (BPND images estimated using a simplified reference tissue model [SRTM]). Bottom row: corresponding BPND images estimated using the SRTM2; it is slightly less noisy than the SRTM, as would be expected.

