
FIGURE 1.
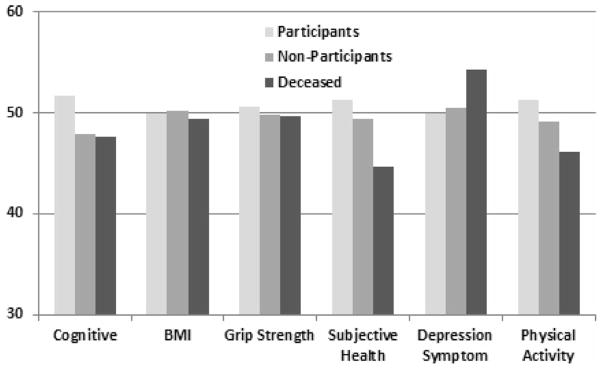
Comparison of MADT follow-up participants (N = 2,402), non-participants (N = 1,484), and deceased (N = 428) on several key intake measures. To facilitate comparison, all measures were adjusted for age and sex effects and then scaled to have a mean of 50 and a standard deviation of 10 in the total MADT intake sample. The group effect is significant for all measures except BMI. However, the magnitude of the difference between participants and non-participants is uniformly small, suggesting little bias due to attrition.