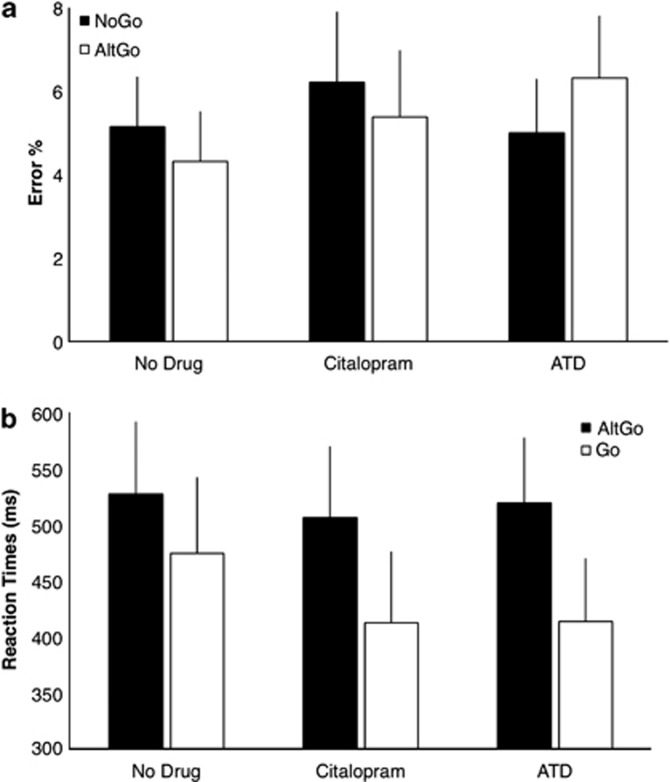
Figure 1.
(a) Commission error rates (group mean and SD) on the NoGo and AltGo trials, under control condition (no drug) and after citalopram or ATD. (b) Reaction times (group mean and SD) for AltGo and Go trials, in the three drug sessions (Statistical analysis in results section: Behavior, biochemistry, and perfusion).

