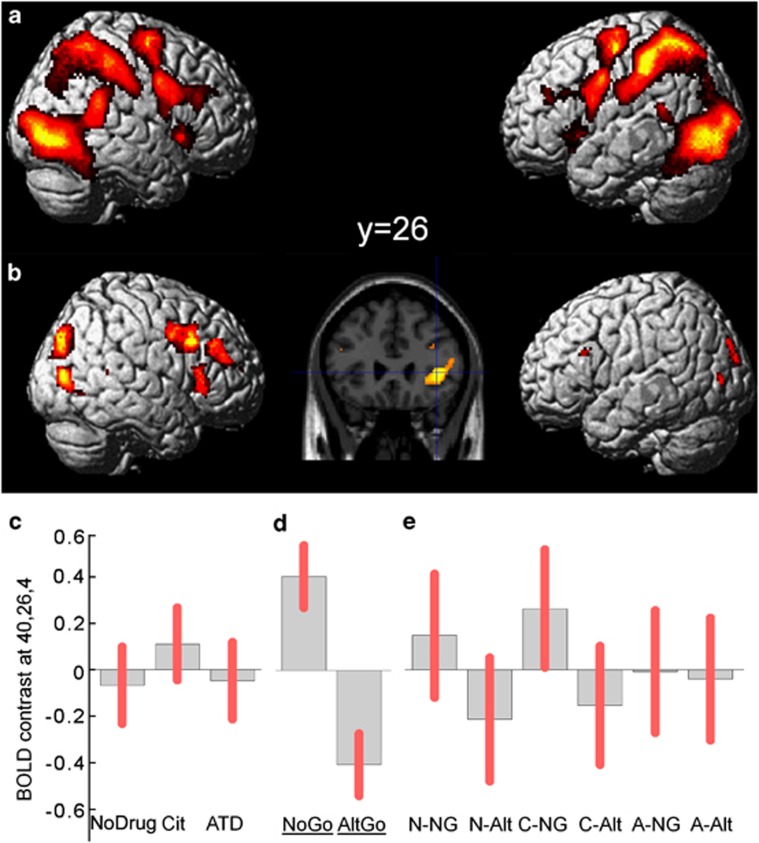
Figure 3.
(a) SPM(t) map thresholded at FWE p<0.05 for the contrast of (NoGo and AltGo) trials vs Go trials. Further activations in IFG were seen within the predefined ROI (see text). Activations are rendered onto a representative brain in MNI space, in lateral views, and confirm the widespread differential activation following low frequency stimuli and resulting cognitive processes of control, updating, or inhibiting a response. (b) Activations of the IFG related to response inhibition, especially on the right, are revealed by the contrast of NoGo vs AltGo trials, here illustrated at p<0.001 (peaks are p<0.05 FWE corrected within the IFG region of interest). The inset slice shows right IFG at y=26. (c) Parameter estimates for voxel 40, 26, 4 in the right IFG (contrast of NoGo vs AltGo by drug session) under control (no drug), citalopram (cit) and ATD. (d) Parameter estimates for voxel 40, 26, 4 in right IFG for NoGo and AltGo trials (averaging over drug session). (e) Parameter estimates for voxel 40, 26, 4 in right IFG shown separately for each combination of drug and trial-type (NG=NoGo, Alt=AltGo, N=no drug, C=citalopram, A=ATD). Relative activation was greater for NoGo trials vs AltGo trials under control and citalopram sessions. Parameter estimates shown in C–E sum to zero across the group, from the flexible factorial design, and are scaled in arbitrary units. Pink error bars indicate 90% confidence intervals of the means.

